Category: Software Development

  • CloudWatch Metrics: Stop averaging,start percentiling

    CloudWatch Metrics: Stop averaging,start percentiling

    AWS CloudWatch is a corner service used by almost all AWS Service teams for monitoring and scaling software systems. Though it is a foundational software service that most businesses could benefit from, CloudWatch’s features are unintuitive and therefore often overlooked. 

    Out of the box, CloudWatch offers users the ability to plot both standard infrastructure and custom application metrics. However, new users can easily make the fatal mistake of plotting their graphs using the default statistic: average. Stop right there! Instead of averages, use percentiles. By switching the statistic type, you are bound to uncover operational issues that have been hiding right underneath your nose.

    In this post, you’ll learn:

    1. About the averages that can hide performance issues
    2. Why software teams favor percentiles
    3. How percentiles are calculated.

    Example scenario: Slowness hiding in plain sight

    Imagine the following scenario between a product manager, A, and an engineer, B, both of them working for SmallBusiness.

    A sends B a slack message, alerting B that customers are reporting slowness with CoffeeAPI:

    A: “Hey — some of our customers are complaining. They’re saying that CoffeeAPI is slower than usual”.

    B: “One second, taking a look…”

    B signs into the AWS Console and pulls up the CloudWatch dashboard. Once the page loads,  he scrolls down to the specific graph that plots CoffeeAPI latency, execution_runtime_in_ms

    He quickly reviews the graph for the relevant time period, the last 24 hours.

    There’s no performance issue, or so it seems. Latencies sit below the team defined threshold, all data points below the 600 milliseconds threshold:
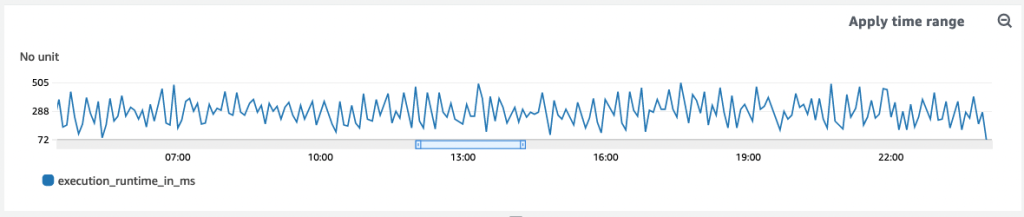
    Plotting the average execution runtime in millseconds

    B: “Um…Look good to me” B reports back.

    A: “Hmm…customers are definitely saying the system takes as long as 900ms…”

    Switching up the statistic from avg to p90

    In B’s mind, he has a gut feeling that something’s off — something isn’t adding up. Are customers misreporting issues?

    Second guessing himself, B modifies the line graph, duplicating the `execution_runtine_in_ms` metric. He tweaks one setting -under the **statistic** field, he swaps out Average for P90.

    Duplicating the metric and changing statistic to P90
    Duplicating the metric and changing statistic to P90

    He refreshes the page and boom — there it is: datapoints revealing latency above 600 milliseconds!

    Some customers’ requests are even taking as long as 998 milliseconds, 300+ milliseconds above the team’s defined service level operation (SLO).
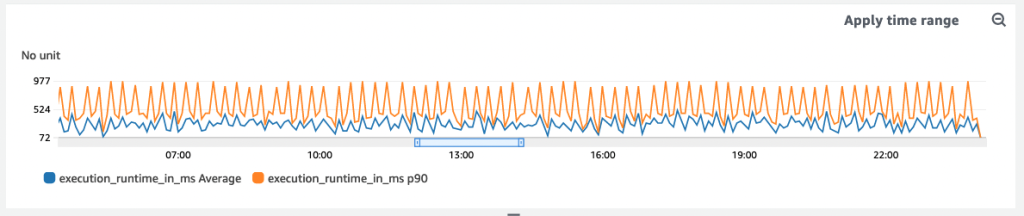
    P90 comparison

    Problematic averages

    Using CloudWatch metrics may seem simple at first. But it’s not that intuitive. What’s more is that by default, CloudWatch plots metrics with the average as the default statistic. As we saw above, this can hide outliers.

    Plans based on assumptions about average conditions usually go wrong.

    Sam Savage

    For any given metric with multiple data points, the average may show no change in behavior throughout the day, when really, there are significant changes.

    Here’s another example: let’s say we want to measure the number of requests per second.

    Sounds simple,right? Not so fast.

    First we need to talk measurements. Do we measure once a second, or by averaging requests over a minute? As we have already discovered, averaging requests can hide higher latencies that arrive in small bursts. Let’s consider a 60 second period as an example. If during the first 30 seconds there are 200 requests per second, and during the last 30 seconds there are zero requests per second, then the average would be 100 requests per second. However, in reality, the “instantaneous load” is twice that amount if there are 200 requests/s in odd-numbered seconds and 0 in others. 

    How to use Percentiles

    Using percentiles makes for smoother software.

    Swapping out average for percentile is advantageous for two reasons: 

    1. metrics are not skewed by outliers and just as important
    2. every percentile data is an actual user experience, not a computed value like average

    Continuing with the above example of a metric that tracks execution time, imagine an application publishing the following data points:

    [535, 400, 735, 999, 342, 701, 655, 373, 248, 412]

    If you average the above data, it comes out to 540 milliseconds, yet for the P90, we get 999 milliseconds. Here’s how we arrived at that number:
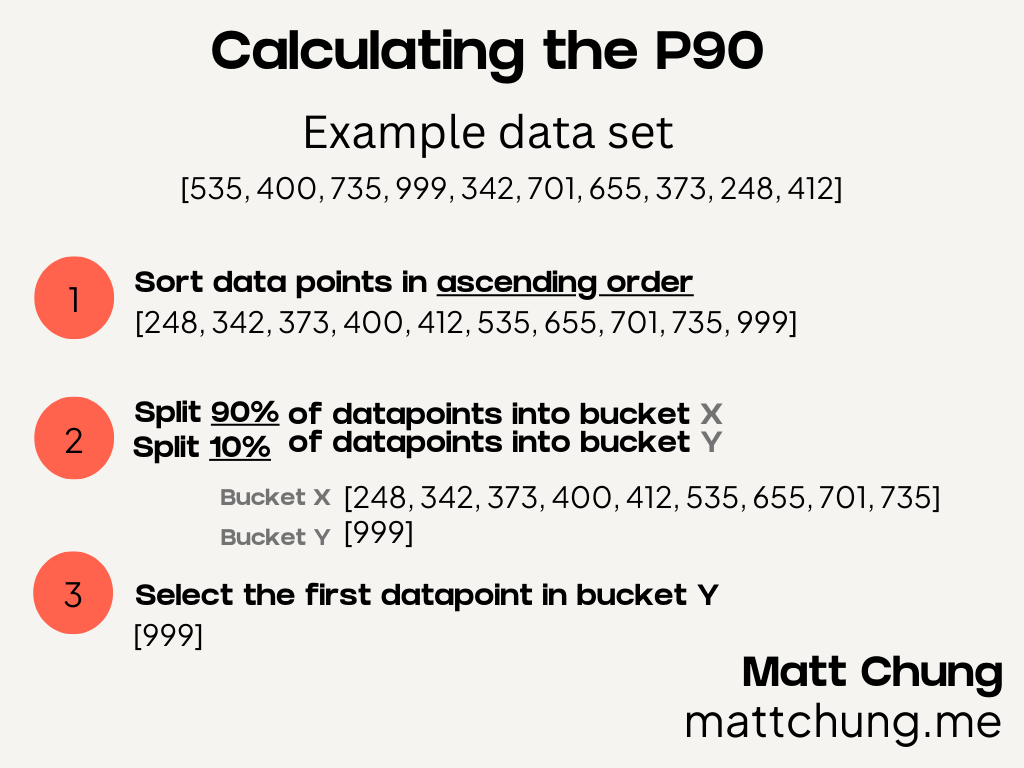
    How to calculate the P90
    How to calculate the P90

    Let’s look at the above graphic in order to calculate the p90. First, start with sorting all the data points for a given time period, sorting them in ascending order from lowest to highest. Next, split the data points into two buckets.  If you want the P90, you split the first 90% of data points into bucket one, and the remaining 10% into bucket two. Similarly, if you want the P50 (i.e. the median), assign 50% of the data points to the first bucket and 50% into the second.

    Finally, after separating the data points into the two buckets, you select the first datapoint in the second bucket. The same steps can be applied to any percentile (e.g. P0, P50, P99).

    Some common percentiles that you can use are p0, p50, p90, p99 and  p99.9. You’ll want to use different percentiles for different alarm thresholds (more on this in an upcoming blog post). Say you are exploring CPU utilization, the p0, p50, and p100 give you the lowest usage, medium usage, and highest usage, respectively.

    Summary

    To conclude, let’s make sure that you’re using percentiles instead of averages so that when you use CloudWatch, you aren’t getting false positives.

    Take your existing graphs and switch over your statistics from average to percentile today, and start uncovering hidden operational issues. Let me know if you make the change and how it positively impacts your systems.

    References

    Chris Jones. “Google – Site Reliability Engineering.” Accessed September 12, 2022. https://sre.google/sre-book/service-level-objectives/.

    Smith, Dave. “How to Metric.” Medium (blog), September 24, 2020. https://medium.com/@djsmith42/how-to-metric-edafaf959fc7.

  • Let’s get lower than Python

    Like a huge swath of other millennial, I dibbled and dabbled in building websites —writing in html, css, and javascript—during my youth, but these days, I primarily code (as a living) in favorite programming language: Python.

    I once considered Python as one of the lower level programming languages (to a certain degree, it is) but as a I dive deeper into studying computer science— reading Computer Systems from a programmer’s perspective, at my own pace, and watching the professors lecture online, for free—I find the language creates too big of a gap between me and system,  leaving me not fully understanding what’s really going on underneath the hood.  Therefore, it’s time to bite the bullet and dive a bit deeper into learning the next not-so-new language on my list: C.

    Why C?  One could argue that if you want to really understand the hardware, learn the language closest to the hardware: assembly (the compiler translates assembly into object code, which, ultimately, executed by the machine).  Yes—assembly is the closest one could get to programming the system, but C strikes a balance.  C can easily be translated into assembly, while maintaining it’s utility (many systems at work still run on C).

    Now, I’m definitely not stopping from writing and learning Python.  I love Python. I learn something new—from discovering standard libraries to writing more idiomatic code—every day.  I doubt that will ever change; I’ll never reach a point where I’ll say “Yup, that’s it, I learned everything about Python.”

    But, I am devoting a large chunk of my time (mostly outside of working hours) on learning C.

    So, my plan is this: finish “The C Programming Language” by Brian Keringhan and Dennis Ritchie. The de-facto book to learn C.

    [1] https://scs.hosted.panopto.com/Panopto/Pages/Sessions/List.aspx#folderID=%22b96d90ae-9871-4fae-91e2-b1627b43e25e%22

  • AWS Lambda part 2 – packaging and deploying

    I received positive feedback on my AWS Lambda presentation in London. This post discusses how to package and deploy your lambda function.

    I’m sure there are other ways but I wanted something simple. This allows me to maintain separate enviroments (i.e “dev”, “production”).

    Makefile

    I use Make to create a package (i.e “sample-app.zip”). The dependencies are installed into a virtualenv which are appended to the package.

    Create the function

    make build-dev
    make create-dev
    

    Deploy the package

    make build-dev
    make update-dev
    
    PROJECT = sample-python-app
    FUNCTION = $(PROJECT)
    REGION = us-east-1
    .phony: clean
    clean:
    rm -f -r $(FUNCTION)*
    rm -f -r site-packages
    build-dev: clean
    aws s3 cp s3://$(FUNCTION)/settings-dev.yml settings.yml
    zip -r $(FUNCTION)-dev.zip . -x *.git* tests/*
    mkdir -p site-packages
    virtualenv $(FUNCTION)-dev
    . $(FUNCTION)-dev/bin/activate
    pip install -r requirements.txt
    cd site-packages; cp -r $$VIRTUAL_ENV/lib/python2.7/site-packages/ ./
    cd site-packages; zip -g -r ../$(FUNCTION)-dev.zip .
    create-dev:
    aws lambda create-function \
    –handler main.lambda_handler \
    –function-name $(FUNCTION)-dev \
    –region $(REGION) \
    –zip-file fileb://$(FUNCTION)-dev.zip \
    –role arn:aws:iam::XXXX:role/$(FUNCTION)-dev \
    –runtime python2.7 \
    –timeout 120 \
    –memory-size 512 \
    update-dev:
    aws lambda update-function-code \
    –function-name $(FUNCTION)-dev \
    –zip-file fileb://$(FUNCTION)-dev.zip \
    –publish \
    delete-dev:
    aws lambda delete-function –function-name $(FUNCTION)-dev

    Lambda deployment package

    Make sure you include all the dependencies in the package. You need to copy the contents of site-packages, NOT the directory itself. If you copy site-packages itself, lambda will not be able to find the modules.

    The contents will look something similar to:

    main.py
    netstorage/
    netstorage/__init__.py
    requests/
    requests/__init__.py

    Testing locally

    Instead of constantly deploying the function, I wanted to test my changes locally.

    When creating an AWS lambda function, you need to specify the handler gets executes. In the gist above, I specify it with –handler main.lambda_handler. So testing locally is simple as:

    if __name__ == "__main__":
        lambda_handler(None, None)
  • Monitoring background processes with SumoLogic

    This post discusses one way we monitor our background process – which is different than how we monitor our web services. It’s difficult when you can’t send a request/poll the service. I wanted something more than checking if the process is alive. One solution we came up with is is using syslog with a log aggregration service.

    Most log aggregration platforms (i.e “Splunk, Log Entries, Sumologic,”) can send an alert if some string (or regex) is found in the the logs. This is pretty common; what about alerting when logs are NOT found?

    Basic Setup

    Our process is managed by supervisor and it logs to stdout. Supervisor logging plugin sends logs to our centralized syslog collector, which forwards the logs to Sumologic. We then configure alerts based off of search results.

    Configuring the alert

    First, create your search (here’s a cheatsheet). Next, configure it:

    • Library -> Edit Search
    • Scheduled this Search
    • Number of results Equal to = 0

    Screenshot:

    Sumologic scheduled search equal to zero/0That’s it. You can integrate this with your Pager Duty account or just have it send directly to an e-mail address.

  • SpeedCurve Library: Travis CI + coverage + tox

    I’m writing a python library (speedcurve.py). At work, we’re using SpeedCurve to track our web performance. SpeedCurve’schangelog reveals can trigger a deployment (and a series of tests). I’m replacing our curl+ansible commands with this. I plan on integrating this with slack as well.

    This project is heavily influenced by github3.py. I’ve been contributing frequently (plan on continuing to) and find it elegant. You’ll notice A LOT of similarities.

    For this project, I want the following up front:
    • Proper Documentation
    • 100% test coverage and flake8 checks
    • Integration with Travis CI

    This post focuses on configuring tox to execute coverage.

    Configure tox + coverage

    Since tox does NOT play nicely with pipes (|), this simple shell scripts checks for 100% test coverage:

    #!/bin/sh
    
    coverage run --source speedcurve -m py.test
    coverage report | tail -n 1 | grep '^TOTAL.*100%$'
    

    This goes in tox.ini

    [testenv:coverage]
    commands =
        ./coverage-check.sh
    
  • Implementing Licenses API for github3.py

    I came across this license issue while searching on GitHub. So, I thought I’d give it a shot. I pinged sigmavirus24 in #github3.py seeing if this was a feature I could implement. He gave the thumbs up and I was off.

    Testing manually first

    Before any implementation, I always like to get a better understanding of the API by using good ol’ fashion curl.

    curl https://api.github.com/licenses \
    -H "Accept: application/vnd.github.drax-preview+json"
    

    Sending a custom Accept: Header

    In the code base, most classes inherit from github3.GitHubCore, which inherits from requests.Session. We can pass in**kwargs, and requests.Session.get accepts a headers as a kwarg. So, we can pass a custom Accept: header like so:

    headers = {
        'Accepts': 'application/vnd.github.drax-preview+json'
    }
    
    url = self._build_url('license')
    json = self._json(self._get(url, headers=headers))
    

    How to add attributes to License model

    By default, the model will not expose any attributes. How do we do that? The key is implementing __update_attributesmethod.

    github3.licenses.License inherits from github3.models.GitHubObject, which calls __update_attriubtes in its__init__.

    class GitHubObject(object):
        """The :class:`GitHubObject <GitHubObject>` object. A basic class to be
        subclassed by GitHubCore and other classes that would otherwise subclass
        object."""
        def __init__(self, json):
            super(GitHubObject, self).__init__()
            if json is not None:
                self.etag = json.pop('ETag', None)
                self.last_modified = json.pop('Last-Modified', None)
                self._uniq = json.get('url', None)
            self._json_data = json
            self._update_attributes(json)
    

    So, let’s add License attributes

    def _update_attributes(self, license):
        self.name = license.get('name')
        self.permitted = license.get('permitted')
        self.category = license.get('category')
        self.forbidden = license.get('forbidden')
        self.featured = license.get('featured')
        self.html_url = license.get('html_url')
        self.body = license.get('body')
        self.key = license.get('key')
        self.description = license.get('description')
        self.implementation = license.get('implementation')
        self.required = license.get('required')
    

    Writing test

    This guide is a great place to start. But, just a few pointers. For unit tests, copy/paste example data the API docs. For example, grab the JSON data from the license documentation. Save it under tests/unit/.

    For integration tests, you’ll need to perform HTTP request(s). The betamax wrapper will record it to tests/cassettes.

    Summary

    This feature was merged in this pull request. I really enjoy contributing to this project. Primarily since sigmavirus24 is a pleasure to work with and extremely helpful. He’s super patient and I appreciate he takes the time onboarding new contributors.

  • Contributing to github3.py

    sigmavirus24 tweetI’ve always been scared of open sourcing, despite wanting to get involved for a long time? Why?

    For a long time, I’ve programmed in isolation. But, I did enjoy it. Unfortunately, this leaves little (to none) opportunity for feedback and critism. Afraid of rejection? Afraid of not appearing as smart as I think I am ?

    Serepdentiosuly, I came across this post on reddit post. His comment looked warm and welcoming. Let’s give it a shot again.

    I received an e-mail from @sigmavirus24. Looks like he could use some help moving existings tests under tests/* to tests/unit and tests/integration. This is a great way to get familiar with the code base. I’m game.

    @sigmavirus24 posted this tweet. I was so happy and I hugged Jessica, who was sitting next to me when I saw it pop up on my feed. I didn’t anticipate it and it is what makes me enjoy working on F/OSS.

    I Was on IRC and dropped a note to @sigmavirus24 about implementing this new API feature. I think I’ll tackle this in parallel with migrating tests over.

  • Mocking boto exception

    I was getting so frustrated.

    I knew how to raise the exception with side_effect=. But, how do you mock the exception?

    try:
        connection = connect_to_sqs
    except BotoServerError as m:
        if m.error_code == "AlreadyExistsException"
    

    To get it to work, I inherited the exception class – BotoServerError

    from boto.exceptions import BotoServerError
    
    class MockBotoServerError(BotoServerError):
        def __init__(self, error_code)
            self.error_code = error_code
    
    @mock.patch('cloudwhale.build.connect_to_sqs', side_effect=MockBotoServerError())
    

    Order of decorator

    Also, pay attention to the order of parameters. My assertions were failing left and right.