Category: Software Development

  • Stop being caught off guard: the art of setting software limits

    Audience: Intermediate to advanced software developers (or startup technical chief technology officers) who build on the cloud and want to scale their software systems

    Are you a software developer building scalable web services serving hundreds, thousands, or millions of users? If you haven’t already considered defining and adding upper limits to your systems— such as restricting the number of requests per second or the maximum request size—then you should. Ideally, you want to do this before releasing your software to production.

    The truth is that web services can get knocked offline for all sorts of reasons.

    It could be transient network failures. Or cheeky software bugs.

    But some of the hairiest outages that I’ve witnessed first-hand? The most memorable ones? They’ve happened when a system either hit an unknown limit on a third dependency (e.g. a file system limit or network limit), or there was a lack of a limit that allowed too much damage (e.g. permitting unlimited number of transactions per second).

    Let’s start by looking at some major Amazon Web Services (AWS) outages. In the first incident, an unknown limit was hit and rocked AWS Kinesis offline. In the second incident, the lack of a limit crippled AWS S3 when a command was mistyped during routine maintenance.

    The enemy: unknown system limits

    AWS Kinesis, a service for processing large-scale data streams, went offline for over 17 hours on November 25, 2020,[1] when the system’s underlying servers unexpectedly hit an unknown system limit, bringing the entire service to its knees.

    On that day, AWS Kinesis was undergoing routine system maintenance, the service operators increasing capacity by adding additional hosts to the front-end fleet that is responsible for routing customer requests. By design, every front-end host is aware of every other front-end host in the fleet. To communicate among themselves, each host spins up a dedicated OS thread. For example, if there are 1,000 front-end hosts, then every host spins up 999 operating system threads. This means that for each server, the number of operating system threads grows directly in proportion to the total number servers.
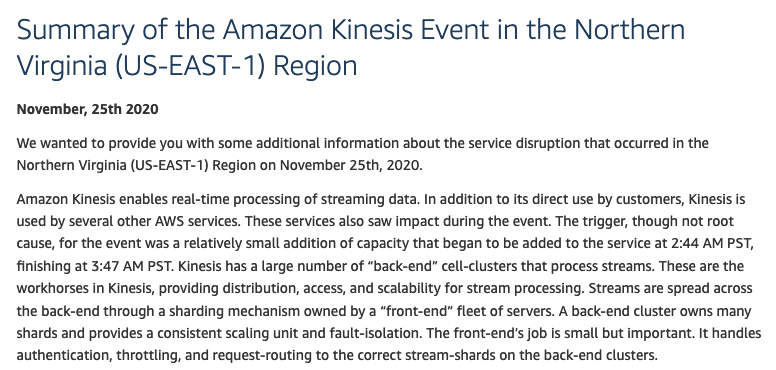
    AWS Public announcement following outage. Source: https://aws.amazon.com/message/11201/

    Unfortunately, during this scale-up event, the front-end hosts hit the maximum OS system thread count limit, which caused the front-end hosts to fail to route requests. Although increasing the OS thread limit was considered as a viable option, the engineers concluded that changing a system-wide parameter across thousands of hosts without prior thorough testing might have potentially introduced other undesirable behavior. (You just never know.) Accordingly, the Kinesis service team opted to roll back the changes (i.e., they removed the recently added hosts) and slowly rebooted their system; after 17 hours, the system fully recovered.

    While the AWS Kinesis team discovered and fixed the maximum operating system thread count limit, they recognized that other unknown limits were probably lurking. For this reason, their follow-up plans included modifying their architecture in an effort to provide “better protection against any future unknown scaling limit.”

    AWS Kinesis’s decision to defend against and anticipate future unknown issues is the right approach: there will always be unknown unknowns. It’s something you can always count on. Not only is the team aware of their blind spots, but they are also aware of limits that are unknown to themselves as well as others, the fourth quadrant in the Johari window:

    Source: Source: https://fundakoca.medium.com/johari-window-9f874884fc10

    At first, it may seem as though the operating system limit was the real problem. However, it was really how the underlying architecture responded to hitting the limit that needed to be resolved. AWS Kinesis, as previously mentioned, decided to address that as part of its rearchitecturing effort.

    No bounds means unlimited damage

    AWS Kinesis suffered an outage due to hitting an unknown system limit, but in the following example, we’ll see how a system without limits can also inadvertently cause an outage.

    On February 28, 2017, the popular AWS S3 (object store) web service failed to process requests: GET, LIST, PUT, and DELETE. In a public service announcement,[2] AWS stated that “one of the inputs to the command was entered incorrectly and a larger set of servers was removed than intended.”

    In short, a typo.

    Figure 3 – Source: https://www.intralinks.com

    Now, server maintenance is fairly a routine operation. Sometimes new hosts are added to address an uptick in traffic; at other times, hosts fail (or hardware becomes deprecated) and need to be replaced. Despite being a routine operation, a limit should be placed on the number of hosts that can be removed. AWS recognized this missing safety limit causing an impact: “While removal of capacity is a key operational practice, in this instance, the tool used allowed too much capacity to be removed too quickly.”

    A practical approach to uncovering limits

    How do we uncover unknown system limits? How do we go about setting limits on our own systems? In both cases, we can start scratching the surface with a three-pronged approach: asking questions, reading documentation, and load testing.

    Asking questions

    Whether it’s done as part of a formal premortem or a part of your system design, there are some questions that you can ask yourself when it comes to introducing system limits to your web service. The questions will vary depending on the specific type of system you are building, but here are a few good, generic starting points:

    • What are the known system limits?
    • How does our system behave when those system limits are hit?
    • Are there any limits we can put in place to protect our customers?
    • Are there any limits we can put in place to protect ourselves?
    • How many requests per second do we allow from a single customer?
    • How many requests per second do we allow cumulatively across all customers?
    • What’s the maximum payload size per request?
    • How will we get notified when limits are close to being hit?
    • How will we get notified when limits are hit?

    Again, there are a million other questions you could/should be asking, but the above can serve as a starting point.

    Reading documentation

    If you’re lucky, either your own system software or third-party software will include technical documentation. Assuming that it is available, use it to familiarize yourself with the limitations.

    Let’s look at a few different examples of how we might uncover some third-party dependency limits.

    Example 1: Route53 Service

    Imagine that you plan on using Amazon Web Services Route53 to provision DNS zones that will host your DNS records. (Shout out to my former colleagues still holding down the fort there. Before integrating with Route53, let’s step through the user documentation.

    AWS Route53 quota on number of hoted zones per account

    Figure 4

    According to the documentation,[3] we cannot create an unlimited number of hosted zones: A single AWS account is capped at creating 500 zones. That’s a reasonable default value, and it is unlikely that you’ll need a higher quota (although, if you do, you can request a higher quota by reaching out to AWS directly).

    AWS Route53 quota on DNS records per zone

    Figure 5

    Similarly, within a single DNS zone, a maximum of 10,000 records can be created. Again, that’s a reasonable limit. However, it’s important to note—even as a thought exercise—how your system will behave if you theoretically hit these limits.

    Example 2: Python Least Recently Used (LRU) Library

    The same principle of reading documentation applies to software library dependencies, too. Say you want to implement a least recently used (LRU) cache using Python’s built-in library functools.[4] By default, the LRU cache defaults the maximum number of elements defaults to 128 items. This limit can be increased or decreased, depending on your needs. However, the documentation reveals a surprising behavior when the argument passed in is set to “None”: The LRU can grow without any limits.

    Like the AWS S3 example previously described, a system without limits can have unintended side effects. In this particular scenario with the LRU, an unbounded cache can lead to memory usage spiraling out of control, potentially eventually eating up all the underlying host’s memory and triggering the operating system to kill the process!

    Load testing

    There are whole books dedicated to load testing, and this article just scratches the surface. Still, I want to lightly touch on the topic since it’s not too uncommon for documentation — your own or third-party dependencies — to omit system limits. Again, by no means is the below a comprehensive load testing strategy; it should only serve as a starting point.

    To begin load testing, start hammering your own system with requests, slowly ramping up the rate over time. One popular tool is Apache JMeter.[5] Begin with sending one request per second, then two, then three and so on, until the system’s behavior starts to change: Perhaps latency increases or the system falls over completely, unable to handle any requests. Maybe the system starts load shedding,[6] dropping requests after a certain rate. The idea is to identify the upper bound of the underlying system.

    Another type of limit worth uncovering is the maximum size of a request. How does your system respond to requests that are 1 MB, 10 MB, 100 MB, 1 GB, and so on? Maybe there’s no maximum request size configured, and the system slows down to a crawl as the payload size increases. If discover that this is the case, you’ll want to set a limit and reject requests above a certain payload size.

    After you are done load testing, document your findings. Write them in your internal wiki, or commit them directly into source code. One way or another, get it written down somewhere.

    Next, you’ll want to start monitoring these limits, creating alarms, and setting up email (or pager) notifications at different thresholds. We’ll explore this topic more deeply in a separate post.

    Summary

    As we’ve seen, its important to uncover unknown system limits. Equally important is setting limits on our own systems, which protects both end users and the system itself. Identifying system limits, monitoring them, and scaling them is a discipline that requires ongoing attention and care, but these small investments can help your systems scale and hopefully reduce unexpected outages.

    References

    Python documentation. “Functools — Higher-Order Functions and Operations on Callable Objects.” Accessed December 20, 2022. https://docs.python.org/3/library/functools.html.

    “Quotas – Amazon Route 53.” Accessed December 20, 2022. https://docs.aws.amazon.com/Route53/latest/DeveloperGuide/DNSLimitations.html.

    Amazon Web Services, Inc. “Summary of the Amazon Kinesis Event in the Northern Virginia (US-EAST-1) Region.” Accessed December 7, 2022. https://aws.amazon.com/message/11201/.

    Amazon Web Services, Inc. “Summary of the Amazon S3 Service Disruption in the Northern Virginia (US-EAST-1) Region.” Accessed December 19, 2022. https://aws.amazon.com/message/41926/.

    “There Are Unknown Unknowns.” In Wikipedia, December 9, 2022. https://en.wikipedia.org/w/index.php?title=There_are_unknown_unknowns&oldid=1126476638.

    Amazon Web Services, Inc. “Using Load Shedding to Avoid Overload.” Accessed December 20, 2022. https://aws.amazon.com/builders-library/using-load-shedding-to-avoid-overload/.


    [1] “Summary of the Amazon Kinesis Event in the Northern Virginia (US-EAST-1) Region.”

    [2] “Summary of the Amazon S3 Service Disruption in the Northern Virginia (US-EAST-1) Region.”

    [3] “Quotas – Amazon Route 53,” 53.

    [4] “Functools — Higher-Order Functions and Operations on Callable Objects.”

    [5] https://jmeter.apache.org/

    [6] “Using Load Shedding to Avoid Overload.”

  • Take the guessing game out of your metrics: publish counters with zero values

    Take the guessing game out of your metrics: publish counters with zero values

    I remember designing a large-scale distributed system as an AWS software engineer. Amazon’s philosophy that “you build it, you own it” means that engineers must, at all times, understand how their underlying systems work. You’re expected to describe the behavior of your system and answer questions based on just a glance at your dashboards.

    Is the system up or down? Are customers experiencing any issues? How many requests have been received at the P50, P90, or P99 levels?

    With millions of customers using the system every second, it’s critical to quickly pinpoint problems, ideally without resorting to other means of troubleshooting (like diving through log files). Being able to detect issues rapidly requires effective use of AWS CloudWatch.

    If you are new to instrumenting code and just beginning to publish custom metrics to CloudWatch, there are some subtle gotchas to beware of, one of which is only publishing metrics when the system is performing work. In other words, during periods of rest, the system can fail to provide metrics with zero value, which may make it difficult to distinguish between the following two scenarios:

    • The system is online/available, but there’s no user activity
    • The system is offline/unavailable

    To differentiate the two, your software must constantly publish metrics even when the system sits idle. Otherwise, you end up with a graph that looks like this:

    CloudWatch graph without publishing zero value metrics

    What jumps out to you?

    Yup, the gaps. They stand out because they represent missing data points. Do they mean we recently deployed an update with a bug that’s causing intermittent crashes? Is our system being affected by flaky hardware? Is the underlying network periodically dropping packets?

    It could be anything.

    Or, as in this case, nothing at all: just no activity.

    No answer is not a real answer

    [We] shouldn’t take absence of evidence as confirmation in either direction

    Maya Shankar on Slight Change of Plans: Who is Scott Menke

    Yesterday, my wife and I took our daughter to the local farmer’s market. While I was getting the stroller out of the car, my wife and daughter sat down to enjoy some donuts. An older gentleman came up and asked my wife whether she would be his partner for some square dancing; he was wearing a leather waistcoat and seemed friendly enough, so she said yes. During the dance, one of the instructors called out a complex set of directions and then asked if everyone understood and was ready to give it a go. All the newbie dancers just looked around nervously, to which he replied:

    “Wonderful. I’ll take your silence as consent.”

    For the record, silence never equates to consent. However, this does serve as a good analogy for the issue being discussed here about monitoring software systems. Getting no response from his students didn’t really tell the dance instructor that they were all set, and getting no metrics from our system doesn’t really tell us that our system is all set. No answer is not a real answer.

    When it comes to monitoring and operating large software systems, we steer away from making any assumptions. We want data. “Lots,” as my three-year-old daughter would say.

    Back to our graph above: The gaps between data points represent idle times when the underlying system was not performing any meaningful work. Instead of not publishing a metric during those periods, we’ll now emit a counter with a value set to zero, which makes the new graph look like this:

    CloudWatch graph with zero publishing zero value metrics

    With the previous gaps now filled with data points, we now know that the system is up and running — it’s alive, just not handling any requests. The system wasn’t misbehaving, just idle. And now, if we see a graph that still has gaps, we know there’s a problem to investigate.

    Lesson learned

    We’ve now seen that any gaps in data can lead to unnecessary confusion. Even when the system is not performing any meaningful work , or not not processing any requests, we want to publish metrics, even if their values are zero. This way we can always know what’s really going on.

  • CloudWatch Metrics: Stop averaging,start percentiling

    CloudWatch Metrics: Stop averaging,start percentiling

    AWS CloudWatch is a corner service used by almost all AWS Service teams for monitoring and scaling software systems. Though it is a foundational software service that most businesses could benefit from, CloudWatch’s features are unintuitive and therefore often overlooked. 

    Out of the box, CloudWatch offers users the ability to plot both standard infrastructure and custom application metrics. However, new users can easily make the fatal mistake of plotting their graphs using the default statistic: average. Stop right there! Instead of averages, use percentiles. By switching the statistic type, you are bound to uncover operational issues that have been hiding right underneath your nose.

    In this post, you’ll learn:

    1. About the averages that can hide performance issues
    2. Why software teams favor percentiles
    3. How percentiles are calculated.

    Example scenario: Slowness hiding in plain sight

    Imagine the following scenario between a product manager, A, and an engineer, B, both of them working for SmallBusiness.

    A sends B a slack message, alerting B that customers are reporting slowness with CoffeeAPI:

    A: “Hey — some of our customers are complaining. They’re saying that CoffeeAPI is slower than usual”.

    B: “One second, taking a look…”

    B signs into the AWS Console and pulls up the CloudWatch dashboard. Once the page loads,  he scrolls down to the specific graph that plots CoffeeAPI latency, execution_runtime_in_ms

    He quickly reviews the graph for the relevant time period, the last 24 hours.

    There’s no performance issue, or so it seems. Latencies sit below the team defined threshold, all data points below the 600 milliseconds threshold:

    Plotting the average execution runtime in millseconds

    B: “Um…Look good to me” B reports back.

    A: “Hmm…customers are definitely saying the system takes as long as 900ms…”

    Switching up the statistic from avg to p90

    In B’s mind, he has a gut feeling that something’s off — something isn’t adding up. Are customers misreporting issues?

    Second guessing himself, B modifies the line graph, duplicating the `execution_runtine_in_ms` metric. He tweaks one setting -under the **statistic** field, he swaps out Average for P90.

    Duplicating the metric and changing statistic to P90
    Duplicating the metric and changing statistic to P90

    He refreshes the page and boom — there it is: datapoints revealing latency above 600 milliseconds!

    Some customers’ requests are even taking as long as 998 milliseconds, 300+ milliseconds above the team’s defined service level operation (SLO).

    P90 comparison

    Problematic averages

    Using CloudWatch metrics may seem simple at first. But it’s not that intuitive. What’s more is that by default, CloudWatch plots metrics with the average as the default statistic. As we saw above, this can hide outliers.

    Plans based on assumptions about average conditions usually go wrong.

    Sam Savage

    For any given metric with multiple data points, the average may show no change in behavior throughout the day, when really, there are significant changes.

    Here’s another example: let’s say we want to measure the number of requests per second.

    Sounds simple,right? Not so fast.

    First we need to talk measurements. Do we measure once a second, or by averaging requests over a minute? As we have already discovered, averaging requests can hide higher latencies that arrive in small bursts. Let’s consider a 60 second period as an example. If during the first 30 seconds there are 200 requests per second, and during the last 30 seconds there are zero requests per second, then the average would be 100 requests per second. However, in reality, the “instantaneous load” is twice that amount if there are 200 requests/s in odd-numbered seconds and 0 in others. 

    How to use Percentiles

    Using percentiles makes for smoother software.

    Swapping out average for percentile is advantageous for two reasons: 

    1. metrics are not skewed by outliers and just as important
    2. every percentile data is an actual user experience, not a computed value like average

    Continuing with the above example of a metric that tracks execution time, imagine an application publishing the following data points:

    [535, 400, 735, 999, 342, 701, 655, 373, 248, 412]

    If you average the above data, it comes out to 540 milliseconds, yet for the P90, we get 999 milliseconds. Here’s how we arrived at that number:

    How to calculate the P90
    How to calculate the P90

    Let’s look at the above graphic in order to calculate the p90. First, start with sorting all the data points for a given time period, sorting them in ascending order from lowest to highest. Next, split the data points into two buckets.  If you want the P90, you split the first 90% of data points into bucket one, and the remaining 10% into bucket two. Similarly, if you want the P50 (i.e. the median), assign 50% of the data points to the first bucket and 50% into the second.

    Finally, after separating the data points into the two buckets, you select the first datapoint in the second bucket. The same steps can be applied to any percentile (e.g. P0, P50, P99).

    Some common percentiles that you can use are p0, p50, p90, p99 and  p99.9. You’ll want to use different percentiles for different alarm thresholds (more on this in an upcoming blog post). Say you are exploring CPU utilization, the p0, p50, and p100 give you the lowest usage, medium usage, and highest usage, respectively.

    Summary

    To conclude, let’s make sure that you’re using percentiles instead of averages so that when you use CloudWatch, you aren’t getting false positives.

    Take your existing graphs and switch over your statistics from average to percentile today, and start uncovering hidden operational issues. Let me know if you make the change and how it positively impacts your systems.

    References

    Chris Jones. “Google – Site Reliability Engineering.” Accessed September 12, 2022. https://sre.google/sre-book/service-level-objectives/.

    Smith, Dave. “How to Metric.” Medium (blog), September 24, 2020. https://medium.com/@djsmith42/how-to-metric-edafaf959fc7.

  • Dirt cheap, reliable cloud infrastructure: How to deploy a Python worker using Digital Ocean’s serverless app platform for $5.00 per month in less than 5 minutes

    Dirt cheap, reliable cloud infrastructure: How to deploy a Python worker using Digital Ocean’s serverless app platform for $5.00 per month in less than 5 minutes

    In this blog post, you’ll learn how to deploy Python based worker using Digital Ocean’s Cloud App Platform for only $5.00 per month — all in less than 5 minutes.

    Deploying a long running process

    Imagine you’re building an designing a distributed system and as part of that software architecture, you have a Linux process that needs to run indefinitely. The process constantly checks a queue (e.g. RabbitMQ, Amazon SQS) and upon receiving a message, will either send an email notification or perform data aggregation. Regardless of the exact work that needs to being carried out, the process needs to be: always on, always running.

    Alternative deployment options

    A long running process can be deployed in a variety of ways, each with its own trade offs. Sure, you can launch an AWS EC2 instance and deploy your program like any other Linux process but that’ll requires additional scripting to stop/start,restart the process; in addition, you need to maintain and monitor the server, not to mention the unnecessary overprovisioning of the compute and memory resources.

    Another option is to modify the program such that it’s short lived. The process starts, performs some body of work, then exits. This modification to the program allows you to deploy the program to AWS Lambda, which can be configured to invoke the job at certain intervals (e.g. one minute, five minutes); this adjustment to the program is necessary since Lambda is designed to run short-lived jobs, having a maximum runtime of 15 minutes.

    Or, you can (as covered in this post), deploy a long running process in Digital Ocean using their App Cloud Platform.

    Code sample

    Below is a snippet of code. I removed most of the boiler plate and kept only the relevant section: the while loop that performs the body of work. For the full source code in this example, you can find it in example-github github repository

        while (proc_runtime_in_secs < MAX_PROC_RUNTIME_IN_SECONDS):
    
      
            logger.info("Proc running for %d seconds", proc_runtime_in_secs)
            start = time.monotonic()
            logger.info("Doing some work")
            work_for = random.randint(MIN_SLEEP_TIME_IN_SECONDS,
                                      MAX_SLEEP_TIME_IN_SECONDS)
    
            elapsed_worker_loop_time_start = time.monotonic()
            elapsed_worker_loop_time_end = time.monotonic()
    
            while ((elapsed_worker_loop_time_end - elapsed_worker_loop_time_start) < work_for):
    
                elapsed_worker_loop_time_end = time.monotonic()
                pass
    
            logger.info("Done working for %d", work_for)
            end = time.monotonic()
            proc_runtime_in_secs += end - start

    If you are curious about why I’m periodically exiting the program after a certain amount of time, it’s a way to increase robustness. I’ll cover this concept in more detail in a separate post but for now, check out the bonus section at the bottom of this post.

    Testing out this program locally

    With the code checked out locally, you can launch the above program with the following command: python3 main.py.

    Setting up Buildpack

    Digital Ocean needs to detect your build and runtime enviroinment. Detection is made possible with build packs. For Python based applications, Digital Ocean scans the repository, searching for one of these three files:

    1. requirements.txt
    2. Pipfile
    3. setup.py

    In our example code repository, I’ve defined a requirements.txt (which is empty since there are no dependencies I declared) to ensure that Digital Ocean detects our repository as a Python based application.

    Bonus Tip: Pinning the runtime

    While not necessary, you should always pin your Python version runtime as a best practice. If you writing locally using Python-3.9.13, then the remote environment should also run the same version. Version matching saves yourself future head aches: a mismatch between your local Python runtime and Digital Ocean’s Python runtime can cause unnecessary and avoidable debugging sessions.

    Runtime.txt

    python-3.9.13

    Step by Step – Deploying your worker

    Follow the below steps on deploying your Python Github Repository as a Digital Ocean worker.

    1. Creating a Digital Ocean “App”

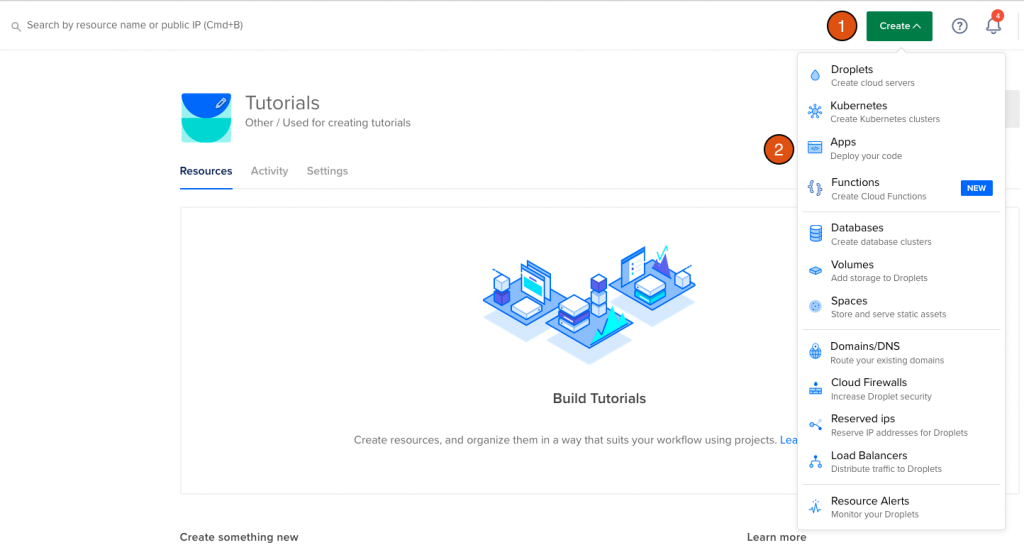
    Log into your digital ocean account and in the top right corner, click “Create” and then select “Apps”.

    Select Create > Apps

    2. Configuring the resource

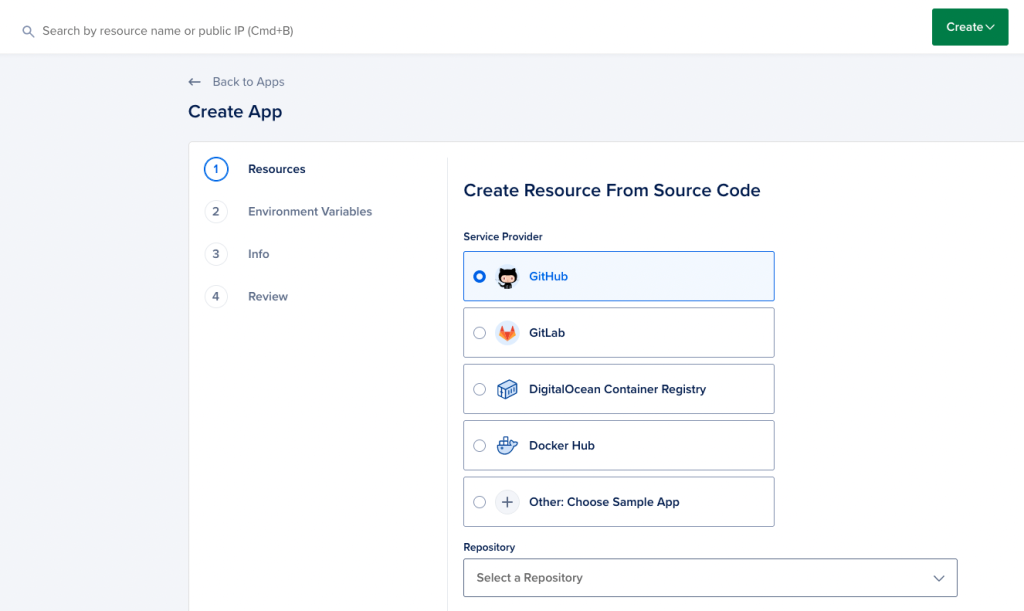
    Select your “Service Provider”. In this example, I’m using GitHub, where this repository is hosted

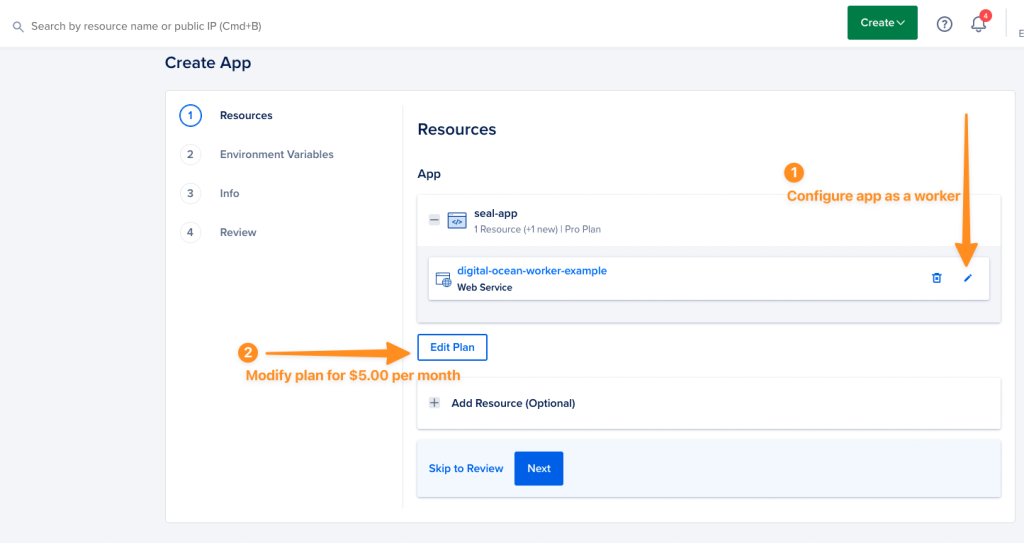
    Then, you need to configure the application as a worker and edit the plan from the default price of $15.00 per month.

    2a – Configure app as a worker

    By default, Digital Ocean assumes that you are building a web service. In this case, we are deploying a worker so select “worker” from the drop down menu.

    2b – Edit the plan

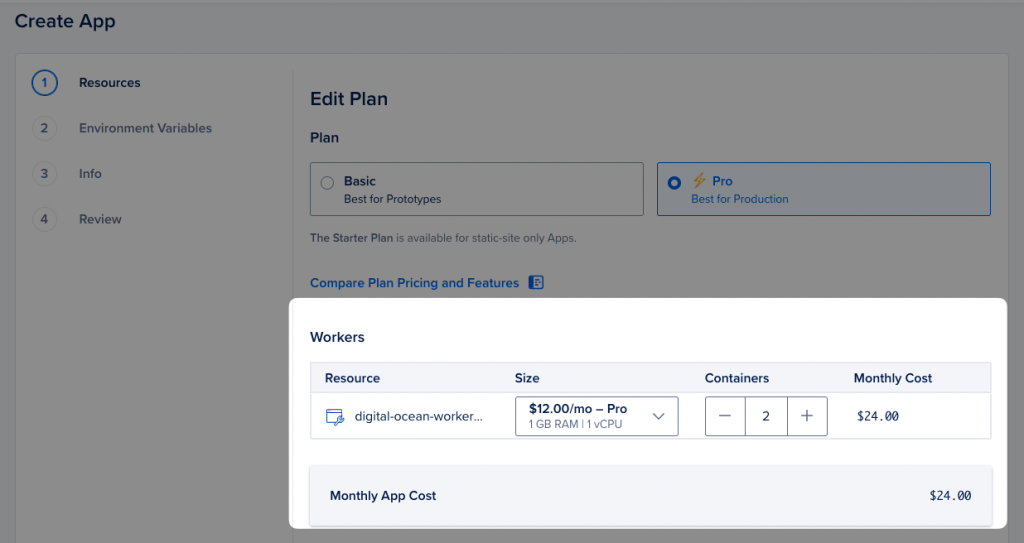
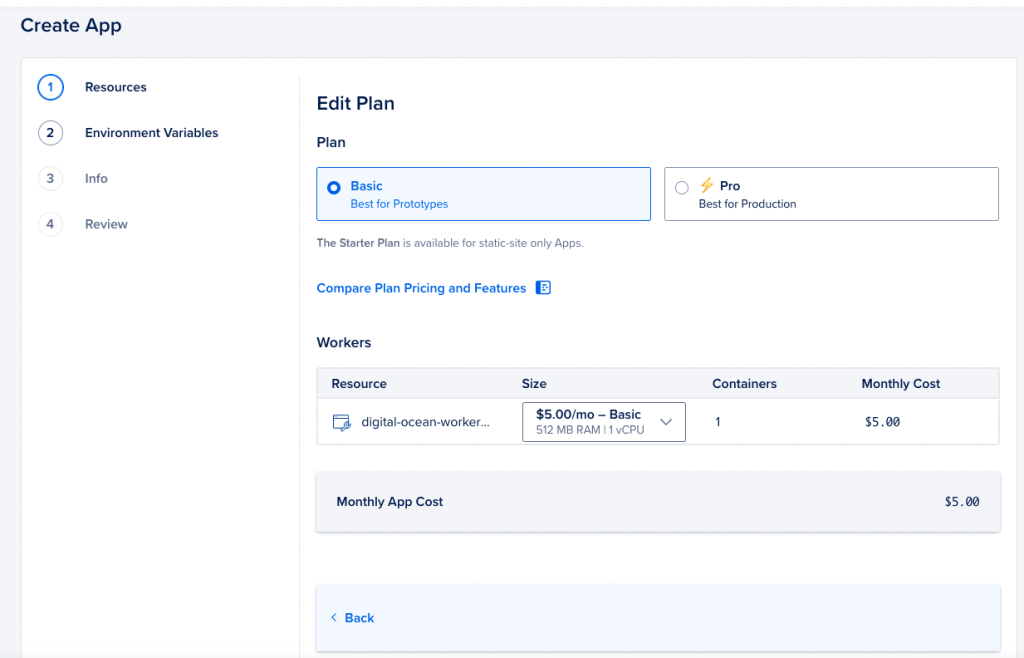
    By default, Digital Ocean chooses a worker with 1GB ram and 1vCPU, costing $24.00 per month. In this example, we do NOT need that entire memory footprint and can get away with half the memory requirements. So let’sw choose 512MB ram, dropping the cost down to $5.00

    Select the “Basic Plan” radio button and adjust the resource size from 1GB RAM to 512 MB ram.

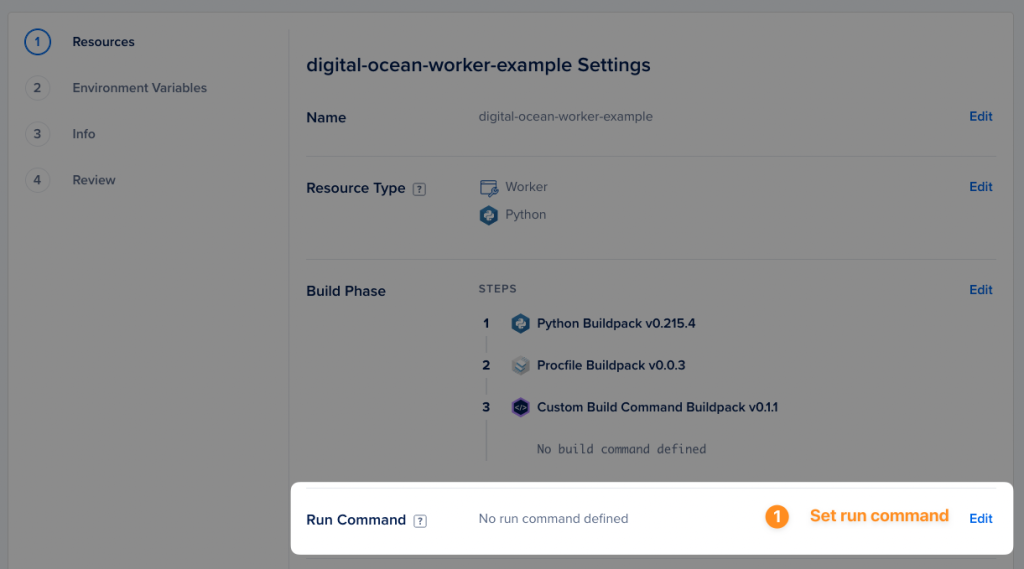
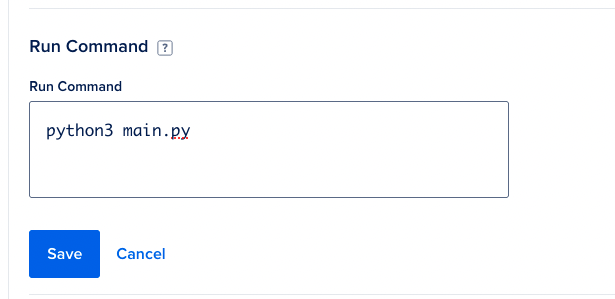
    Configure the run command

    Although we provided other files (i.e. requirements.txt) so that Digital Ocean detects the application as a Python program, we still need to specify wihch command will actually run.

    You’re done!

    That’s it! Select your datacenters (e.g. New York, San Francisco) and then hit that save button.

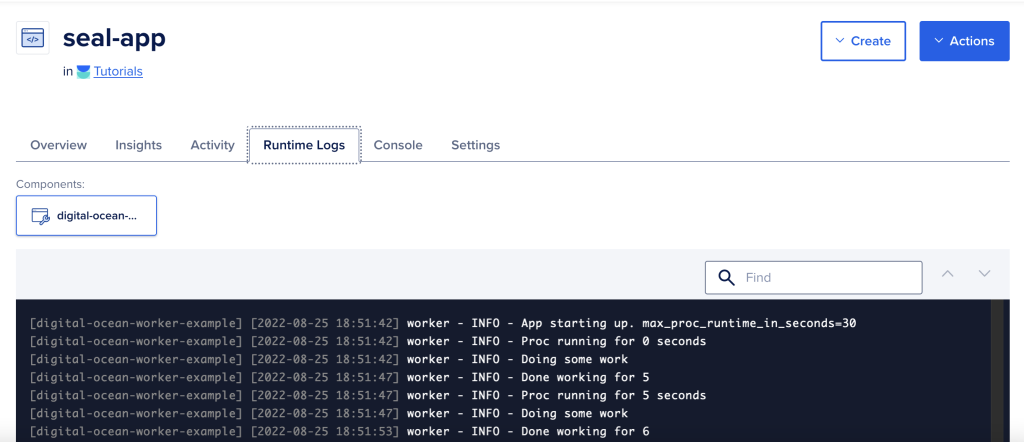
    The application will now be deployed and within a few minutes, you’ll be able to monitor the application by reviewing the Runtime logs.

    Monitoring the runtime logs

    In our sample application, we are writing to standard output/standard error. By doing writing to these file handles, Digital Ocean will capture these messages and log them for you, including a timestamp. Useful for debugging and troubleshooting errors or if your application crashes.

    Bonus: Automatic restart of your process

    If you worker crashes, Digital Ocean monitors the process and will automatically start it. That means, no need to have a control process that forks your process and monitors the PID.

    Who is my audience here? Self-taught developers who want to deploy their application cost effectively, CTOs who are trying to minimize cost for running a long running process

    Summary

    So in this post, we took your long running worker (Python) process and deployed it on Digital Ocean for $5.00 per month!

    References

    1. https://docs.aws.amazon.com/whitepapers/latest/how-aws-pricing-works/aws-lambda.html
    2. https://docs.digitalocean.com/products/app-platform/reference/buildpacks/python/
  • “Is my service up and running?” Canaries to the rescue

    “Is my service up and running?” Canaries to the rescue

    You launched your service and rapidly onboarding customers. You’re moving fast, repeatedly deploying one new feature after another. But with the uptick in releases, bugs are creeping in and you’re finding yourself having to troubleshoot, rollback, squash bugs, and then redeploy changes. Moving fast but breaking things. What can you do to quickly detect issues — before your customers report them?

    Canaries.

    In this post, you’ll learn about the concept of canaries, example code, best practices, and other considerations including both maintenance and financial implications with running them.

    Back in early 1900s, canaries were used by miners for detecting carbon monoxide and other dangerous gases. Miners would bring their canaries down with them to the coalmine and when their canary stopped chirping, it was time for the everyone to immediately evacuate.

    In the context of computing systems, canaries perform end-to-end testing, aiming to exercise the entire software stack of your application: they behave like your end-users, emulating customer behavior. Canaries are just pieces of software that are always running and constantly monitoring the state of your system; they emit metrics into your monitoring system (more discussion on monitoring in a separate post), which then triggers an alarm when some defined threshold breaches.

    What do canaries offer?

    Canaries answer the question: “Is my service running?” More sophisticated canaries can offer a deeper look into your service. Instead of canaries just emitting a binary 1 or 0 — up or down — they can be designed such that they emit more meaningful metrics that measure latency from the client’s perspective.

    First steps with building your canary

    If you don’t have any canaries running that monitor your system, you don’t necessarily have to start with rolling your own. Your first canary can require little to no code. One way to gain immediate visibility into your system would be to use synthetic monitoring services such as BetterUptime or PingDom or StatusCake. These services offer a web interface, allowing you to configure HTTP(s) endpoints that their canaries will periodically poll. When their systems detect an issue (e.g. TCP connection failing, bad HTTP response), they can send you email or text notifications.

    Or if your systems are deployed in Amazon Web Services, you can write Python or Node scripts that integrate with CloudWatch (click here for Amazon CloudWatch documentation).

    But if you are interested in developing your own custom canaries that do more than a simple probe, read on.

    Where to begin

    Remember, canaries should behave just like real customers. Your customer might be a real human being or another piece of software. Regardless of the type of customer, you’ll want to start simple.

    Similar to the managed services describe above, your first canary should start with emitting a simple metric into your monitoring system, indicating whether the endpoint is up or down. For example, if you have a web service, perform a vanilla HTTP GET. When successful, the canary will emit http_get_homepage_success=1 and under failure, http_get_homepage_success=0.

    Example canary – monitoring cache layer

    Imagine you have a simple key/value store system that serves as a caching layer. To monitor this layer, every minute our canary will: 1) perform a write 2) perform a read 3) validate the response.


    [code lang=”python”]
    while(True):
    successful_run = False
    try: put_response = cache_put(‘foo’, ‘bar’)
    write_successful = put_response == ‘OK’
    Publish_metric(‘cache_engine_successful_write’, write_successful)
    value = cache_get(‘foo’) successful_read = value = ‘bar’ publish_metric(‘cache_engine_successful_read’, is_successful_read)
    canary_successful_run = True
    Except as error:
    log_exception(“Canary failed due to error: %s” % error)
    Finally:
    Publish_metric(‘cache_engine_canary_successful_run’, int(successful_run))
    sleep_for_in_seconds = 60 sleep(sleep_for_in_seconds)
    [/code]

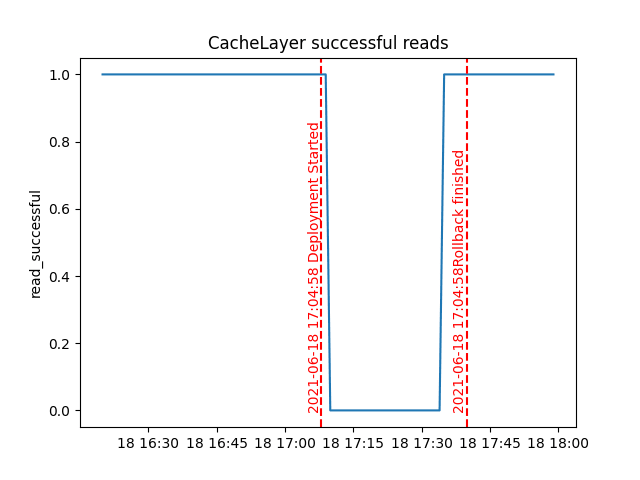
    Cache Engine failure during deployment

    With this canary in place emitting metrics, we might then choose to integrate the canary with our code deployment pipeline. In the example below, I triggered a code deployment (riddled with bugs) and the canary detected an issue, triggering an automatic rollback:

    Canary detecting failures

    Best Practices

    The above code example was very unsophisticated and you’ll want to keep the following best practices in mind:

    • The canaries should NOT interfere with real user experience. Although a good canary should test different behaviors/states of your system, they should in no way interfere with the real user experience. That is, their side effects should be self contained.
    • They should always be on, always running, and should be testing at a regular intervals. Ideally, the canary runs frequently (e.g. every 15 seconds, every 1 minute).
    • The alarms that you create when your canary reports an issue should only trigger off more than one datapoint. If your alarms fire off on a single data point, you increase the likelihood of false alarms, engaging your service teams unnecessarily.
    • Integrate the canary into your continuous integration/continuous deployment pipeline. Essentially, the deployment system should monitor the metrics that the canary emits and if an error is detected for more then N minutes, the deployment should automatically roll back (more of safety of automated rollbacks in a separate post)
    • When rolling your own canary, do more than just inspect the HTTP headers. Success criteria should be more than verifying that the HTTP status code is a 200 OK. If your web services returns payload in the form of JSON, analyze the payload and verify that it’s both syntactically and semantically correct.

    Cost of canaries

    Of course, canaries are not free. Regardless of whether or not you rely on a third party service or roll your own, you’ll need to be aware of the maintenance and financial costs.

    Maintenance

    A canary is just another piece of software. The underlying implementation may be just few bash scripts cobbled together or full blown client application. In either case, you need to maintain them just like any other code package.

    Financial Costs

    How often is the canary running? How many instances of the canary are running? Are they geographically distributed to test from different locations? These are some of the questions that you must ask since they impact the cost of running them.

    Beyond canaries

    When building systems, you want a canary that behaves like your customer, one that allows you to quickly detect issues as soon as your service(s) chokes. If you are vending an API, then your canary should exercise the different URIs. If you testing the front end, then your canary can be programmed mimic a customer using a browser using libraries such as selenium.

    Canaries are a great place to start if you are just launching a service. But there’s a lot more work required to create an operationally robust service. You’ll want to inject failures into your system. You’ll want a crystal clear understanding of how your system should behave when its dependencies fail. These are some of the topics that I’ll cover in the next series of blog posts.

    Let’s Connect

    Let’s connect and talk more about software and devops. Follow me on Twitter: @memattchung

  • Why all developers should learn how to perform basic network troubleshooting

    Why all developers should learn how to perform basic network troubleshooting

    Regardless of whether you work on the front-end or back-end, I think all developers should gain some proficiency in network troubleshooting. This is especially true if you find yourself gravitating towards lower level systems programming.

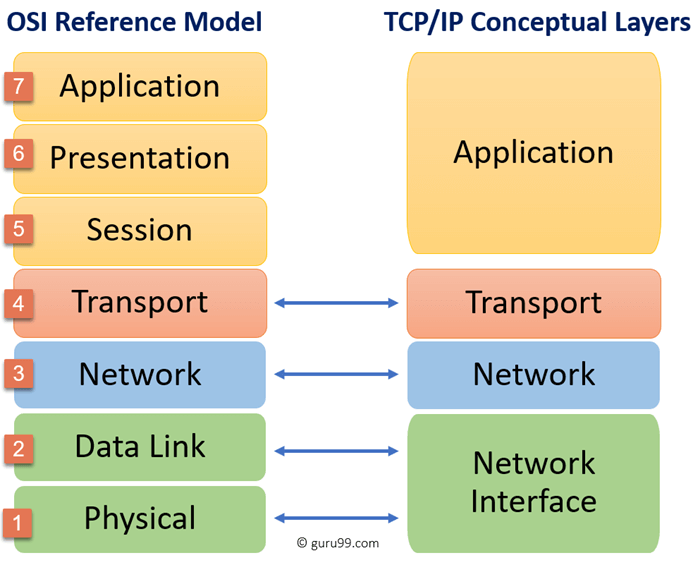
    The ability to troubleshoot the network and systems separates good developers from great developers. Great developers understand not just code abstraction, but understand the TCP/IP model:

    Source: https://www.guru99.com/tcp-ip-model.html

    Some basic network troubleshooting skills

    If you are just getting into networking, here are some basic tools you should add to your toolbelt:

    • Perform a DNS query (e.g. dig or nslookup command)
    • Send an ICMP echo request to test end to end IP connectivity (i.e. ping command)
    • Analyze the various network hops (i.e. traceroute X.X.X.X)
    • Check whether you can establish a TCP socket connection (e.g. telnet X.X.X.X [port])
    • Test application layer (i.e. curl https://somedomain)
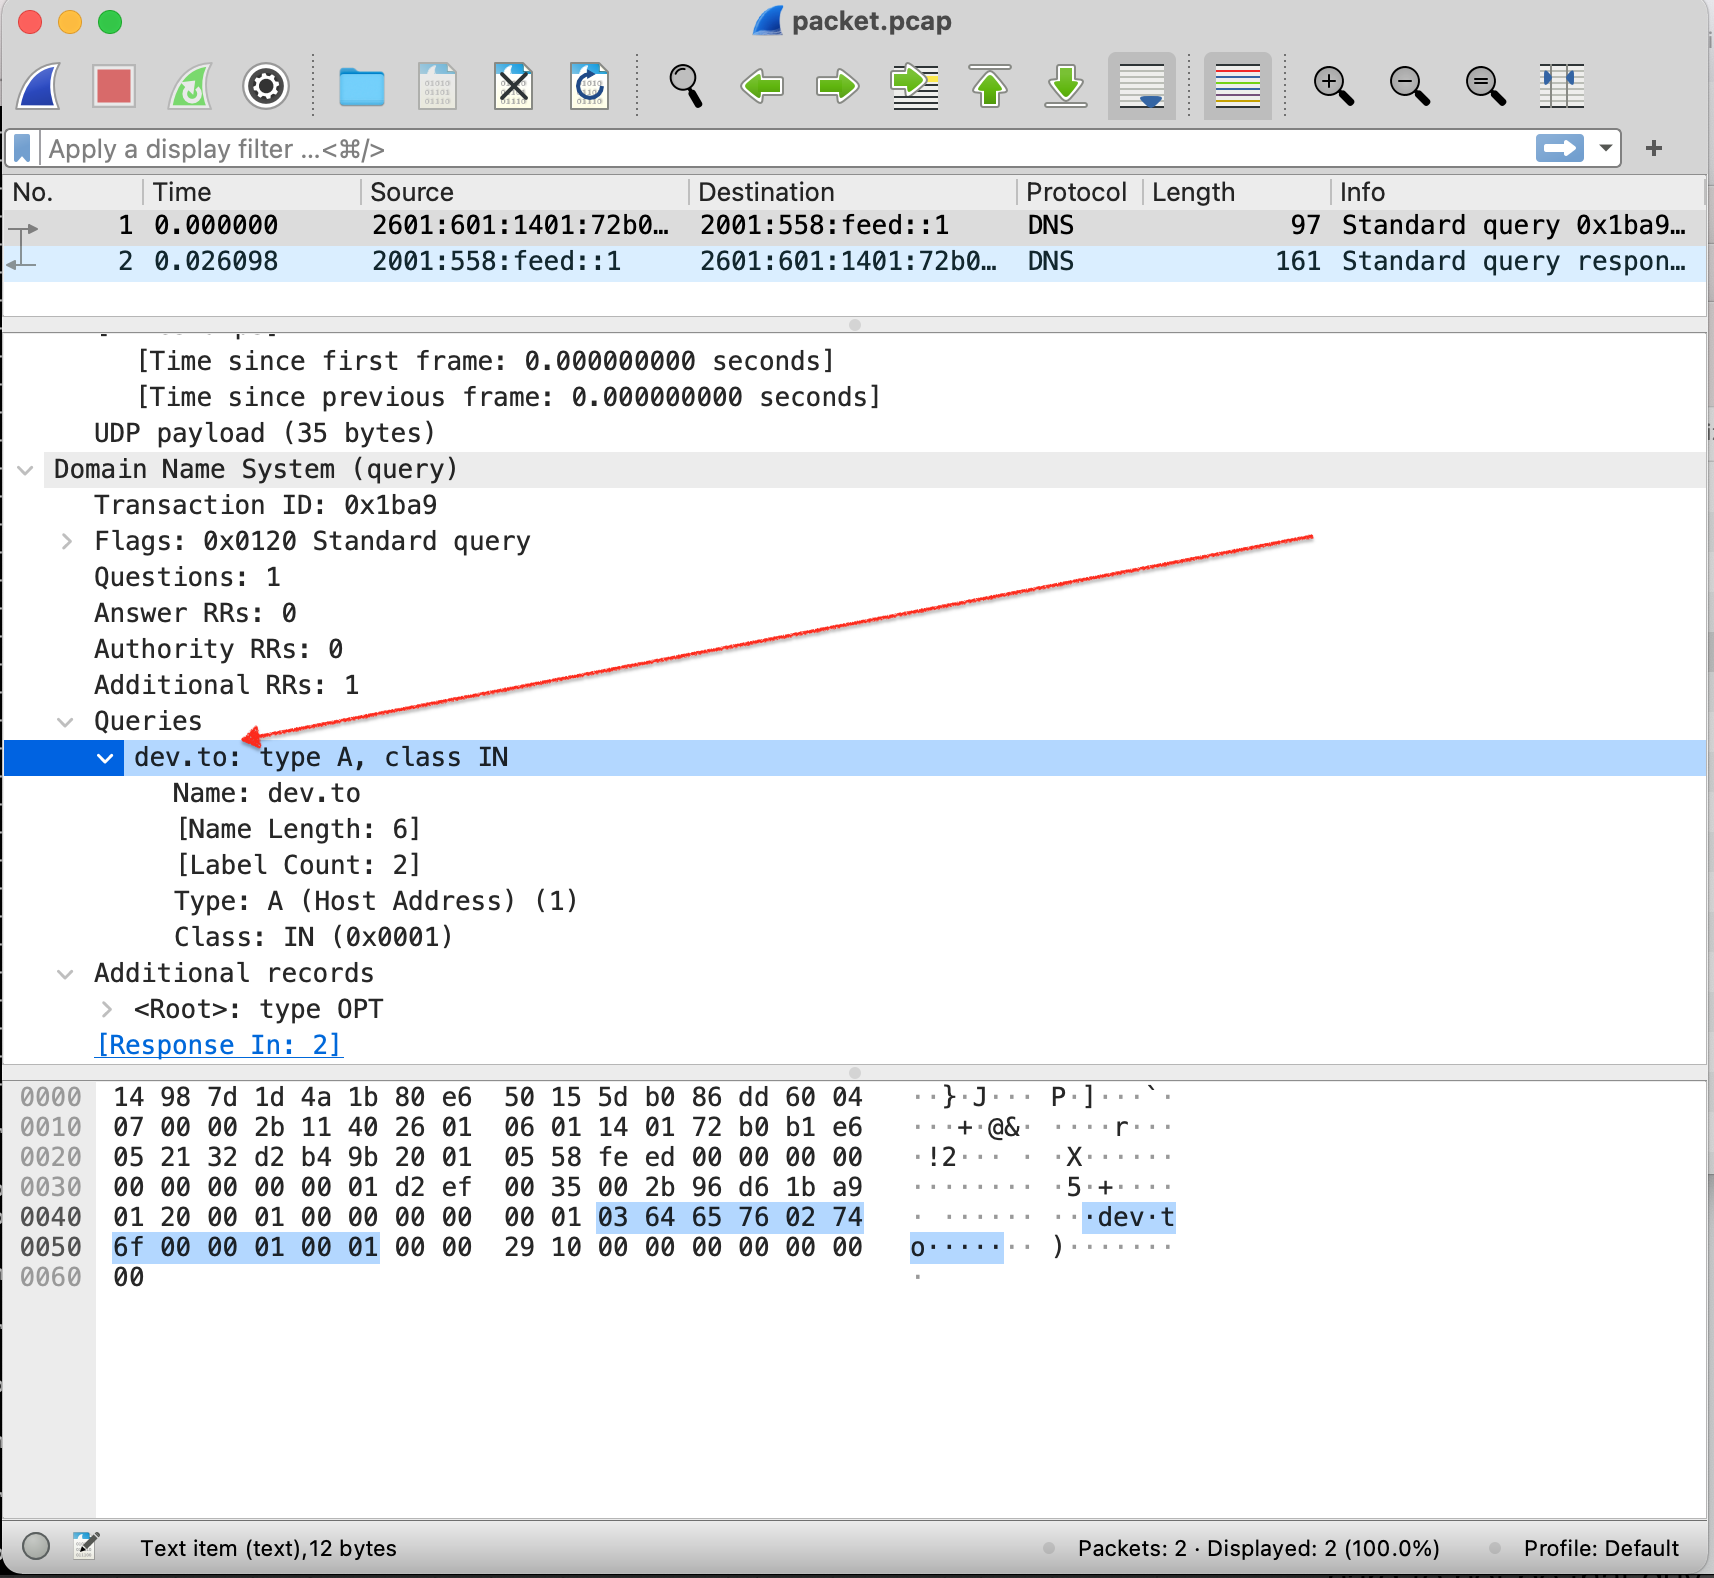
    • Perform a packet capture (e.g. tcpdump -i any) and what bits are sent on the wire

    What IP address is my browser connecting to?

    % dig dev.to
    
    ; <<>> DiG 9.10.6 <<>> dev.to
    ;; global options: +cmd
    ;; Got answer:
    ;; ->>HEADER<<- opcode: QUERY, status: NOERROR, id: 39029
    ;; flags: qr rd ra; QUERY: 1, ANSWER: 4, AUTHORITY: 0, ADDITIONAL: 1
    
    ;; OPT PSEUDOSECTION:
    ; EDNS: version: 0, flags:; udp: 512
    ;; QUESTION SECTION:
    ;dev.to.                IN  A
    
    ;; ANSWER SECTION:
    dev.to.         268 IN  A   151.101.2.217
    dev.to.         268 IN  A   151.101.66.217
    dev.to.         268 IN  A   151.101.130.217
    dev.to.         268 IN  A   151.101.194.217

    Is the web server listening on the HTTP port?

    % telnet 151.101.2.217 443
    Trying 151.101.2.217...
    Connected to 151.101.2.217.
    Escape character is '^]'.
    

    Each of the above tools helps you isolate connectivity issues. For example, if your client receives an HTTP 5XX error, you can immediately rule out any TCP level issue. That is, you don’t need to use telnet to check whether there’s a firewall issue or whether the server is listening in on the right socket: the server already sent an application level response.

    Summary

    Learning more about the network stack helps you quickly pinpoint and isolate problems:

    • Is it my client-side application?
    • Is it a firewall blocking certain ports?
    • Is there a transient issue on the network?
    • Is the server up and running?
  • Why all developers should learn how to perform basic network troubleshooting

    Why all developers should learn how to perform basic network troubleshooting

    (Also published on Hackernoon.com and Dev.to)

    Regardless of whether you work on the front-end or back-end, I think all developers should gain some proficiency in network troubleshooting. This is especially true if you find yourself gravitating towards lower level systems programming.

    The ability to troubleshoot the network and systems separates good developers from great developers. Great developers understand not just code abstraction, but understand the TCP/IP model:

    Source: https://www.guru99.com/tcp-ip-model.html

    Some basic network troubleshooting skills

    If you are just getting into networking, here are some basic tools you should add to your toolbelt:

    • Perform a DNS query (e.g. dig or nslookup command)
    • Send an ICMP echo request to test end to end IP connectivity (i.e. ping command)
    • Analyze the various network hops (i.e. traceroute X.X.X.X)
    • Check whether you can establish a TCP socket connection (e.g. telnet X.X.X.X [port])
    • Test application layer (i.e. curl https://somedomain)
    • Perform a packet capture (e.g. tcpdump -i any) and what bits are sent on the wire

    What IP address is my browser connecting to?

    % dig dev.to
    
    ; <<>> DiG 9.10.6 <<>> dev.to
    ;; global options: +cmd
    ;; Got answer:
    ;; ->>HEADER<<- opcode: QUERY, status: NOERROR, id: 39029
    ;; flags: qr rd ra; QUERY: 1, ANSWER: 4, AUTHORITY: 0, ADDITIONAL: 1
    
    ;; OPT PSEUDOSECTION:
    ; EDNS: version: 0, flags:; udp: 512
    ;; QUESTION SECTION:
    ;dev.to.                IN  A
    
    ;; ANSWER SECTION:
    dev.to.         268 IN  A   151.101.2.217
    dev.to.         268 IN  A   151.101.66.217
    dev.to.         268 IN  A   151.101.130.217
    dev.to.         268 IN  A   151.101.194.217
    

    Is the web server listening on the HTTP port?

    % telnet 151.101.2.217 443
    Trying 151.101.2.217...
    Connected to 151.101.2.217.
    Escape character is '^]'.
    

    Each of the above tools helps you isolate connectivity issues. For example, if your client receives an HTTP 5XX error, you can immediately rule out any TCP level issue. That is, you don’t need to use telnet to check whether there’s a firewall issue or whether the server is listening in on the right socket: the server already sent an application level response.

    Summary

    Learning more about the network stack helps you quickly pinpoint and isolate problems:

    • Is it my client-side application?
    • Is it a firewall blocking certain ports?
    • Is there a transient issue on the network?
    • Is the server up and running?

    Let’s chat more about network engineering and software development

    If you are curious about learning how to move from front-end to back-end development, or from back-end development to low level systems programming, hit me up on Twitter: @memattchung

  • Software craftsmanship: convey intent in your error codes

    Software craftsmanship: convey intent in your error codes

    ENOTSUP stands for “Error – not supported” and it is one of the many error codes defined in the error header file.

    I recently learned about this specific error code when reviewing a pull request that my colleague had submitted. His code review contained an outline — a skeleton — of how we envisioned laying out a new control plane process that would allow upcoming dataplane processes to integrate with.

    And he kept this initial revision very concise, only defining the signature of the functions and simply returning the error code ENOTSUP.

    The advice of returning relevant error codes applies not only to the C programming language, but applies to other languages too, like Python. But instead of error codes, you should instead raise specific Exceptions.

    Who cares

    So what’s so special about a one liner that returns this specific error code?

    Well, he could’ve instead added a comment and simply returned negative one (i.e. -1). That approach would’ve done the job just fine. But what I like about him returning a specific error code is that doing so conveys intent. It breathes meaning into the code. With that one liner, the reader (me and other developers on the team) immediately get a sense that that code will be replaced and filled in in future revisions.

    Example

    Say you are building a map reduce framework and in your design, you are going to spawn a thread for each of phases (e.g. map, reduce). And let’s also say you are working on this project with a partner, who is responsible for implementing the map part of the system. Leaving them a breadcrumb would be helpful:

    int worker_thread_do_map(uint32_t thread_id)
    {
    /* implement feature here and return valid error code */
        return -ENOTSUP;
    }
    
    int worker_thread_do_reduce(uint32_t thread_id)
    {
        return -ENOTSUP;
    }

    The take away

    The take away here is that we, as developers, should try and convey meaning and intent for the reader, the human sitting behind the computer. Cause we’re not just writing for our compiler and computer. We’re writing for our fellow craftsman.

  • 3 tips on getting eyeballs on your code review

    3 tips on getting eyeballs on your code review

    “Why is nobody reviewing my code?”

    I sometimes witness new engineers (or even seasoned engineers new to the company) submit code reviews that end up sitting idle, gaining zero traction. Often, these code reviews get published but comments never flow in, leaving the developer left scratching their head, wondering why nobody seems to be taking a look. To help avoid this situation, check out the 3 tips below for more effective code reviews.

    3 tips for more effective code reviews

    Try out the three tips for more effective code reviews. In short, you should:

    1. Assume nobody cares
    2. Strive for bite sized changes
    3. Add a descriptive summary

    1. Assume nobody cares

    After you hit the publish button, don’t expect other developers to flock to your code review. In fact, it’s safe to assume that nobody cares. I know, that sounds a bit harsh but as Neil Strauss suggests,

    “Your challenge is to assume — to count on — the completely apathy of the reader. And from there, make them interested.”

    At some point in our careers, we all fall into this trap. We send out a review, one that lacks a clear description (see section below “Add a descriptive summary”) and then the code review would sometimes sits there, patiently waiting for someone to sprinkle comments. Sometimes, those comments never come.

    Okay, it’s not that people don’t necessary care. It has more to do with the fact people are busy, with their own tasks and deliverable. They too are writing code that they are trying to ship. So your code review essentially pulls them away from delivering their own work. So, make it as easy as possible for them to review.

    One way to do gain their attention is simply by giving them a heads up.

    Before publishing your code review, send them an instant message or e-mail, giving them a heads up. Or if you are having a meeting with that person, tell them that you plan on sending out a code review and ask them if they can take a look at the code review. This puts your code review on their radars. And if you don’t see traction in an appropriate (which varies, depending on change and criticality), then follow up with them.

    2. Strive for bite sized code reviews

    Anything change beyond than 100-200 lines of code requires a significant amount of mental energy (unless the change itself is a trivial updates to comments or formatting). So how can you make it easier for your reviewer?

    Aim for small, bite sized code reviews.

    In my experience, a good rule of them is submit less than 100 lines of code. What if there’s no way your change can squeeze into double digits? Then consider breaking down the single code review into multiple, smaller sized code reviews and once all those independent code reviews are approved, submit a single code review that merges all those changes in atomically.

    And if you still cannot break down a large code review into these lengths and find that it’s unavoidable to submit a large code review, then make sure you schedule a 15-30 minute meeting to discuss your large code review (I’ll create a separate blog post for this).

    3. Add a descriptive summary for the change

    I’m not suggesting you write a miniature novel when adding a description to your code review. But you’ll definitely need to write something with more substance than a one-liner: “Adds new module”. Rob Pike put’s it succinctly and his criteria for a good description includes “What, why, and background”.

    In addition to adding this criteria, be sure to describe how you tested your code — or, better yet, ship your code review with unit tests. Brownie points if you explicitly call out what is out of scope. Limiting your scope reduces the possibility of unnecessary back-and-forth comments for a change that falls outside your scope.

    Finally, if you want some stricter guidelines on how to write a good commit message, you might want to check out Kabir Nazir’s blog post on “How to write good commit messages.”

    Summary

    If you are having trouble with getting traction on your code reviews, try the above tips. Remember, it’s on you, the submitter of the code review, to make it as easy as possible for your reviews to leave comments (and approve).

    Let’s chat more and connect! Follow me on Twitter: @memattchung

  • Let’s get lower than Python

    Like a huge swath of other millennial, I dibbled and dabbled in building websites —writing in html, css, and javascript—during my youth, but these days, I primarily code (as a living) in favorite programming language: Python.

    I once considered Python as one of the lower level programming languages (to a certain degree, it is) but as a I dive deeper into studying computer science— reading Computer Systems from a programmer’s perspective, at my own pace, and watching the professors lecture online, for free—I find the language creates too big of a gap between me and system,  leaving me not fully understanding what’s really going on underneath the hood.  Therefore, it’s time to bite the bullet and dive a bit deeper into learning the next not-so-new language on my list: C.

    Why C?  One could argue that if you want to really understand the hardware, learn the language closest to the hardware: assembly (the compiler translates assembly into object code, which, ultimately, executed by the machine).  Yes—assembly is the closest one could get to programming the system, but C strikes a balance.  C can easily be translated into assembly, while maintaining it’s utility (many systems at work still run on C).

    Now, I’m definitely not stopping from writing and learning Python.  I love Python. I learn something new—from discovering standard libraries to writing more idiomatic code—every day.  I doubt that will ever change; I’ll never reach a point where I’ll say “Yup, that’s it, I learned everything about Python.”

    But, I am devoting a large chunk of my time (mostly outside of working hours) on learning C.

    So, my plan is this: finish “The C Programming Language” by Brian Keringhan and Dennis Ritchie. The de-facto book to learn C.

    [1] https://scs.hosted.panopto.com/Panopto/Pages/Sessions/List.aspx#folderID=%22b96d90ae-9871-4fae-91e2-b1627b43e25e%22