I’ve entered the 6th week of my stretching journey. In today’s program (12), we focused on the following muscles: calves, quadriceps, and ankles.
Throughout this journey, I’m semi-regularly tracking my progress because I have this vision — a very clear image (which almost brings me to tears thinking about it) — of me moving gracefully, without pain: the source of pain turning into source of pleasure. This vision is somewhat far into the future, anywhere between 2-5 years (by then, my age will be between 38-41).
Notes
Total duration of today’s program about 19-20 minutes
Equipment relied on was 1) a mat to support the knees 2) chair for the squat and 3) bolster to adjust the seiza position, the Japanese kneeling position
The focus was on the calves, quadriceps, ankles
Listened to my wise mind and added much needed adjustments like both sitting on the bolster, resting my ankles on top of a folded up sweater since ankles could not sustain being pressed against hardwood floor. In the past, I avoided adjustments, perceiving myself as weak. But I’ve abandoned that idea, welcoming adjustments to create an environment that’s conducive for relaxing into the stretch
Today I experienced another instance of actuallyenjoying stretching, no longer trying to “search for” or “experience” pain. Instead of forcing myself through the pain, pushing through the pain. I’m minimizing and avoiding it all together. Those previous strategies (e.g. no pain no gain), do not serve me in my quest of becoming a supple leopard.
I’m continuing to open up to finding alternative exercises at varying intensities that work for my body
Eye opener experience for me is (and continues to be) tilting the pelvis (or as they say “tucking the tail”), which avoids tweaking my lower back during certain exercises like the quadriceps stretch
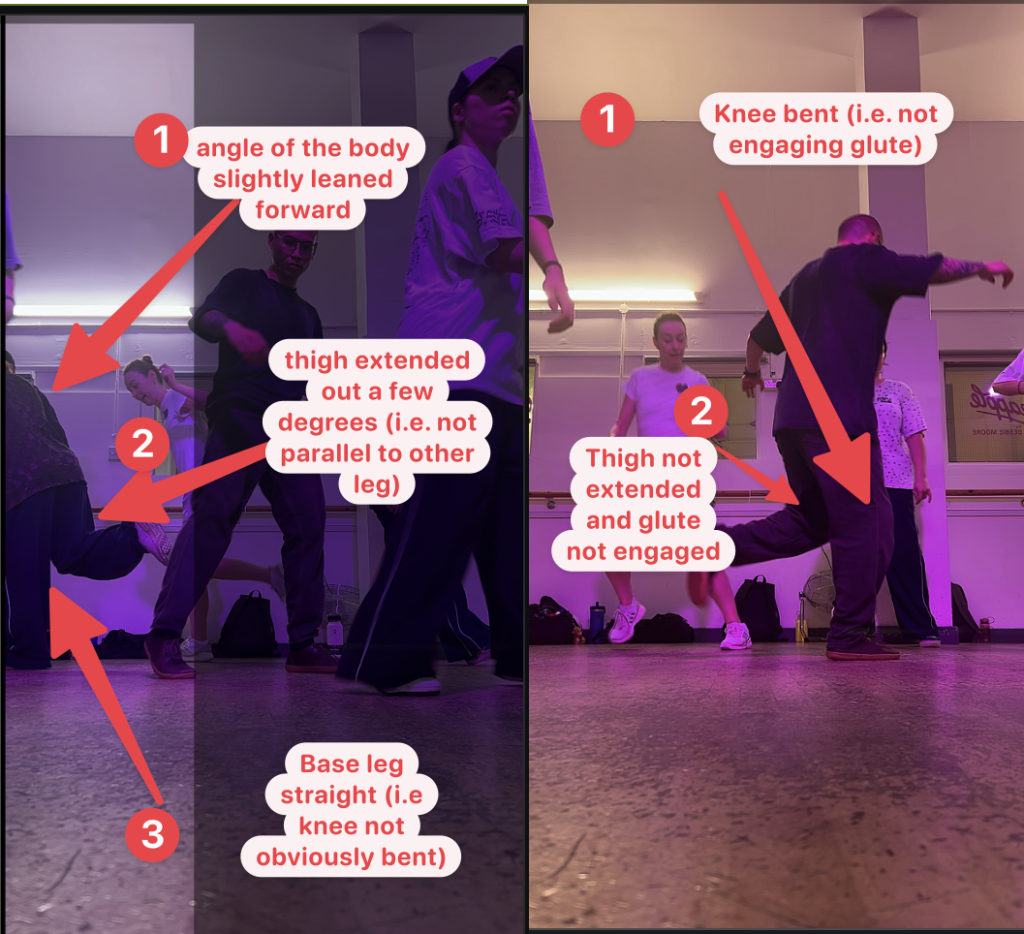
I almost always post recap videos on Instagram after taking dance classes (of course unless the class does not permit or discourages filming). In addition to capturing, creating and posting these videos (that hopefully show the spirit of the class), I’ll sometimes review clips of me dancing in class, playing back certain moves that I remember not “clicking” during the class; then I will try to observe and identify what specific parts of the move I’d like to refine. From yesterday’s class, one move (there are others) that I noticed I want to evaluate and improve was the part of the loose leg transition: the toe tap.
I like to be as specific as possible when attempting to self-correct a movement. And while there may be other aspects that could be “cleaned up”, the two that I’m going to direct my focus towards are:
The the angle of the tapping leg when its lifting in the air – was not engaging the gluteus muscle (more on this below)
The straightness of the base leg – again, was not engaging the gluteus
As a relatively new dancer (i.e. less than a year), it’s not always obvious to me what appears “off” (that’s why I feel private 1:1 are so effective because instructors can often immediately articulate what specifically needs attention).
In other words, sometimes my eye detects something needs improvement but I’m not able to pinpoint specifically what I’d like to change.
As such, I will juxtaposition two videos side by side, lining up two clips: the first clip of someone I consider performing the move that inspires me and the second clip of myself. I then frame by frame play back the two videos in sync (a whole separate topic), relying on my eye to spot the subtle differences.
After analyzing the above sequence, I walked over to the mirror hung up in my bedroom flat and then watched myself in the mirror as I emulated he r movement. I attempted to both straighten the base leg and lifted the tapping leg. What’s most interesting about this exercise is that (like I continually to learn over and over) I was essentially not engaging mygluteus muscles. My directing my attention to them and flexing them, the move itself cleaned up.
So in short, dance for me serves as a mechanism — a vehicle — for increasing body awareness.
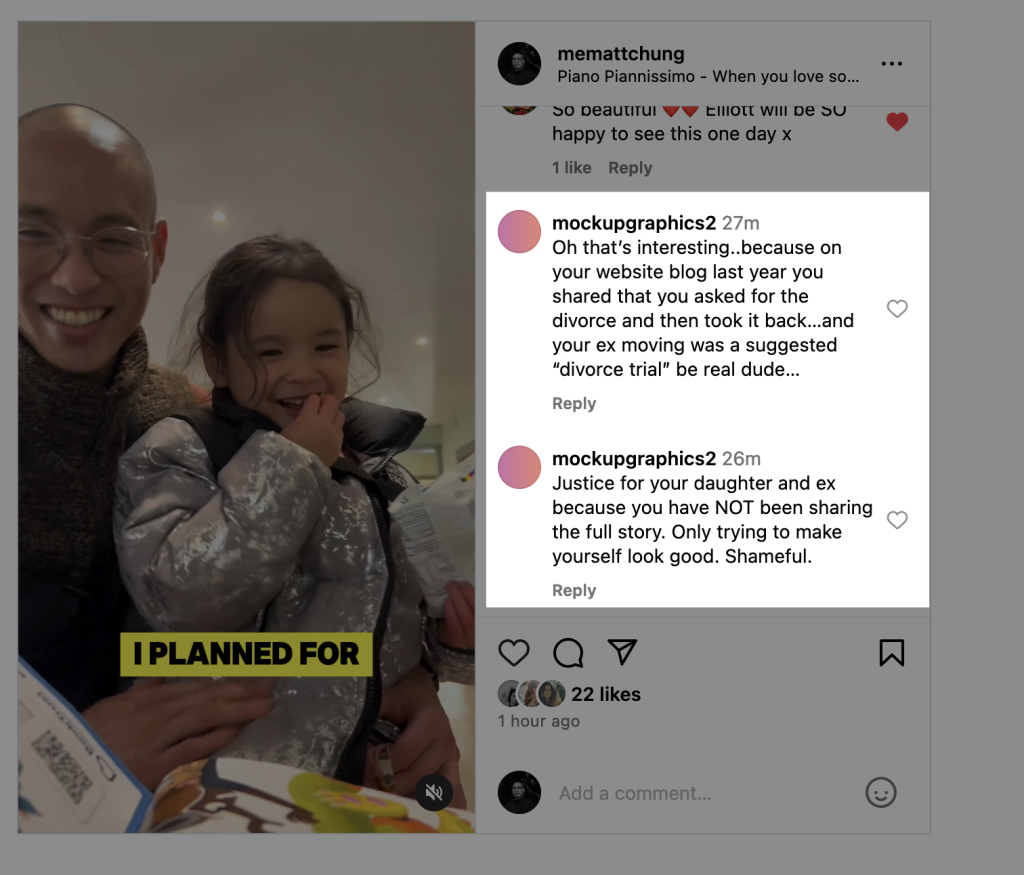
Yesterday I experienced a moment of sadness after reading a comment (see screenshot below) posted by (burner) Instagram account. I had thoughts that this person may be Jess (since I had blocked her account — along with her family — after she had repeatedly brought up my Instagram stories up during mediation and it was becoming increasingly painful and disappointing), a friend or family member of hers, or perhaps her new partner.
I’m not sure and not only will I never know … and it’s not in my values to identify this person.
Their comment definitely caught me off guard. I initially experienced guilt — not shame — and then I checked (and continuing to check) the facts. Ultimately, the guilt is not justified.
However, this person is right to some degree: I have not been sharing the full story.
That’s deliberate.
The reason isn’t to create a false narrative.
The reason isn’t to make myself “look good” as this person posits.
The reason is this: it’s not within my values to share the whole story because doing so would, in my opinion, make Jess’s behaviors public and I am treating both mediation and divorce as sensitive and not something I feel is within my values nor necessary to share with random strangers on the internet. In other words, it would be unfair to her. Unfair to Elliott as well.
Ultimately, as much as I disagree with her behaviors, which is driven by a difference in our values, it’s not in my wise mind to share those sensitive details with everyone publicly.
I haven’t posted on this blog for almost a year. And I miss writing. A lot.
Interestingly enough, I observed that I stopped publishing my own writing when my attention and intention shifted towards growing an audience, when I had decided to “professionalize” my blog and create a funnel for business. A part of me was crippled by fear of failing, so I just stopped writing all together.
Now, I’d like to rediscover a way to write, to express creativity, and at the same time, publish writing that others will find interesting and useful.
But first, time to rebuild that writing muscle. Here are some recent life updates:
Recent life updates
Of all the updates below, I would say the most significant events are:
Diagnosed with adult ADHD at the age of 34 – met with (2) different psychiatrists and discovered that in addition to ADHD, I exhibit traits for other conditions
Started doing things for fun, like dancing – When I founded Crossbill in 2021, I more or less stopped doing all fun activities and focused all my attention and effort into growing the business.
Under high distress, I suggested that my wife and I take time apart – During an argument between my wife and I, I (on the surface, appearing calm) suggested that we separate and take some time apart. I had expected her to push back, to in some way, tell me the idea was non-sense. Instead, she agreed. That sent me into a spiral and I proceeded to sit on the couch and cry uncontrollably and disassociated and unable to articulate what I was feeling. This specific event altered the course of not only my relationship with my wife, but my life (grateful for the incident)
Enrolled and started dialectical behavior therapy (DBT) – I signed up for Greenlake Therapy Group’s Dialectical behavior therapy (DBT) program and it has been … life changing, giving me tools and skills to regulate my emotions, build interpersonal skills and ultimately, build a life worth living.
Wife and daughter move to London – my wife (Jess) and daughter (Elliott) moved to London and we’re intentionally taking time apart while I focus (on my above) program in person, here in Seattle.
Audience: Intermediate to advanced software developers (or startup technical chief technology officers) who build on the cloud and want to scale their software systems
Are you a software developer building scalable web services serving hundreds, thousands, or millions of users? If you haven’t already considered defining and adding upper limits to your systems— such as restricting the number of requests per second or the maximum request size—then you should. Ideally, you want to do this before releasing your software to production.
The truth is that web services can get knocked offline for all sorts of reasons.
It could be transient network failures. Or cheeky software bugs.
But some of the hairiest outages that I’ve witnessed first-hand? The most memorable ones? They’ve happened when a system either hit an unknown limit on a third dependency (e.g. a file system limit or network limit), or there was a lack of a limit that allowed too much damage (e.g. permitting unlimited number of transactions per second).
Let’s start by looking at some major Amazon Web Services (AWS) outages. In the first incident, an unknown limit was hit and rocked AWS Kinesis offline. In the second incident, the lack of a limit crippled AWS S3 when a command was mistyped during routine maintenance.
The enemy: unknown system limits
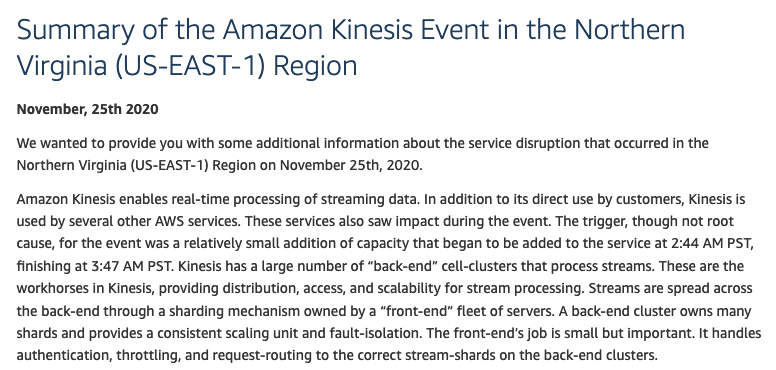
AWS Kinesis, a service for processing large-scale data streams, went offline for over 17 hours on November 25, 2020,[1] when the system’s underlying servers unexpectedly hit an unknown system limit, bringing the entire service to its knees.
On that day, AWS Kinesis was undergoing routine system maintenance, the service operators increasing capacity by adding additional hosts to the front-end fleet that is responsible for routing customer requests. By design, every front-end host is aware of every other front-end host in the fleet. To communicate among themselves, each host spins up a dedicated OS thread. For example, if there are 1,000 front-end hosts, then every host spins up 999 operating system threads. This means that for each server, the number of operating system threads grows directly in proportion to the total number servers.
AWS Public announcement following outage. Source: https://aws.amazon.com/message/11201/
Unfortunately, during this scale-up event, the front-end hosts hit the maximum OS system thread count limit, which caused the front-end hosts to fail to route requests. Although increasing the OS thread limit was considered as a viable option, the engineers concluded that changing a system-wide parameter across thousands of hosts without prior thorough testing might have potentially introduced other undesirable behavior. (You just never know.) Accordingly, the Kinesis service team opted to roll back the changes (i.e., they removed the recently added hosts) and slowly rebooted their system; after 17 hours, the system fully recovered.
While the AWS Kinesis team discovered and fixed the maximum operating system thread count limit, they recognized that other unknown limits were probably lurking. For this reason, their follow-up plans included modifying their architecture in an effort to provide “better protection against any future unknown scaling limit.”
AWS Kinesis’s decision to defend against and anticipate future unknown issues is the right approach: there will always be unknown unknowns. It’s something you can always count on. Not only is the team aware of their blind spots, but they are also aware of limits that are unknown to themselves as well as others, the fourth quadrant in the Johari window:
At first, it may seem as though the operating system limit was the real problem. However, it was really how the underlying architecture responded to hitting the limit that needed to be resolved. AWS Kinesis, as previously mentioned, decided to address that as part of its rearchitecturing effort.
No bounds means unlimited damage
AWS Kinesis suffered an outage due to hitting an unknown system limit, but in the following example, we’ll see how a system without limits can also inadvertently cause an outage.
On February 28, 2017, the popular AWS S3 (object store) web service failed to process requests: GET, LIST, PUT, and DELETE. In a public service announcement,[2] AWS stated that “one of the inputs to the command was entered incorrectly and a larger set of servers was removed than intended.”
In short, a typo.
Figure 3 – Source: https://www.intralinks.com
Now, server maintenance is fairly a routine operation. Sometimes new hosts are added to address an uptick in traffic; at other times, hosts fail (or hardware becomes deprecated) and need to be replaced. Despite being a routine operation, a limit should be placed on the number of hosts that can be removed. AWS recognized this missing safety limit causing an impact: “While removal of capacity is a key operational practice, in this instance, the tool used allowed too much capacity to be removed too quickly.”
A practical approach to uncovering limits
How do we uncover unknown system limits? How do we go about setting limits on our own systems? In both cases, we can start scratching the surface with a three-pronged approach: asking questions, reading documentation, and load testing.
Asking questions
Whether it’s done as part of a formal premortem or a part of your system design, there are some questions that you can ask yourself when it comes to introducing system limits to your web service. The questions will vary depending on the specific type of system you are building, but here are a few good, generic starting points:
What are the known system limits?
How does our system behave when those system limits are hit?
Are there any limits we can put in place to protect our customers?
Are there any limits we can put in place to protect ourselves?
How many requests per second do we allow from a single customer?
How many requests per second do we allow cumulatively across all customers?
What’s the maximum payload size per request?
How will we get notified when limits are close to being hit?
How will we get notified when limits are hit?
Again, there are a million other questions you could/should be asking, but the above can serve as a starting point.
Reading documentation
If you’re lucky, either your own system software or third-party software will include technical documentation. Assuming that it is available, use it to familiarize yourself with the limitations.
Let’s look at a few different examples of how we might uncover some third-party dependency limits.
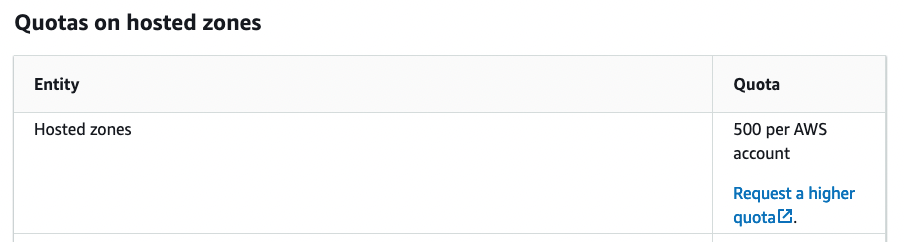
Example 1: Route53 Service
Imagine that you plan on using Amazon Web Services Route53 to provision DNS zones that will host your DNS records. (Shout out to my former colleagues still holding down the fort there. Before integrating with Route53, let’s step through the user documentation.
AWS Route53 quota on number of hoted zones per account
Figure 4
According to the documentation,[3] we cannot create an unlimited number of hosted zones: A single AWS account is capped at creating 500 zones. That’s a reasonable default value, and it is unlikely that you’ll need a higher quota (although, if you do, you can request a higher quota by reaching out to AWS directly).
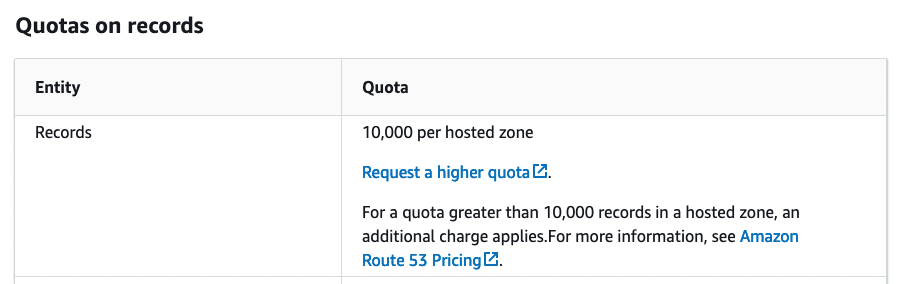
AWS Route53 quota on DNS records per zone
Figure 5
Similarly, within a single DNS zone, a maximum of 10,000 records can be created. Again, that’s a reasonable limit. However, it’s important to note—even as a thought exercise—how your system will behave if you theoretically hit these limits.
Example 2: Python Least Recently Used (LRU) Library
The same principle of reading documentation applies to software library dependencies, too. Say you want to implement a least recently used (LRU) cache using Python’s built-in library functools.[4] By default, the LRU cache defaults the maximum number of elements defaults to 128 items. This limit can be increased or decreased, depending on your needs. However, the documentation reveals a surprising behavior when the argument passed in is set to “None”: The LRU can grow without any limits.
Like the AWS S3 example previously described, a system without limits can have unintended side effects. In this particular scenario with the LRU, an unbounded cache can lead to memory usage spiraling out of control, potentially eventually eating up all the underlying host’s memory and triggering the operating system to kill the process!
Load testing
There are whole books dedicated to load testing, and this article just scratches the surface. Still, I want to lightly touch on the topic since it’s not too uncommon for documentation — your own or third-party dependencies — to omit system limits. Again, by no means is the below a comprehensive load testing strategy; it should only serve as a starting point.
To begin load testing, start hammering your own system with requests, slowly ramping up the rate over time. One popular tool is Apache JMeter.[5] Begin with sending one request per second, then two, then three and so on, until the system’s behavior starts to change: Perhaps latency increases or the system falls over completely, unable to handle any requests. Maybe the system starts load shedding,[6] dropping requests after a certain rate. The idea is to identify the upper bound of the underlying system.
Another type of limit worth uncovering is the maximum size of a request. How does your system respond to requests that are 1 MB, 10 MB, 100 MB, 1 GB, and so on? Maybe there’s no maximum request size configured, and the system slows down to a crawl as the payload size increases. If discover that this is the case, you’ll want to set a limit and reject requests above a certain payload size.
After you are done load testing, document your findings. Write them in your internal wiki, or commit them directly into source code. One way or another, get it written down somewhere.
Next, you’ll want to start monitoring these limits, creating alarms, and setting up email (or pager) notifications at different thresholds. We’ll explore this topic more deeply in a separate post.
Summary
As we’ve seen, its important to uncover unknown system limits. Equally important is setting limits on our own systems, which protects both end users and the system itself. Identifying system limits, monitoring them, and scaling them is a discipline that requires ongoing attention and care, but these small investments can help your systems scale and hopefully reduce unexpected outages.
References
Python documentation. “Functools — Higher-Order Functions and Operations on Callable Objects.” Accessed December 20, 2022. https://docs.python.org/3/library/functools.html.
“Quotas – Amazon Route 53.” Accessed December 20, 2022. https://docs.aws.amazon.com/Route53/latest/DeveloperGuide/DNSLimitations.html.
Amazon Web Services, Inc. “Summary of the Amazon Kinesis Event in the Northern Virginia (US-EAST-1) Region.” Accessed December 7, 2022. https://aws.amazon.com/message/11201/.
Amazon Web Services, Inc. “Summary of the Amazon S3 Service Disruption in the Northern Virginia (US-EAST-1) Region.” Accessed December 19, 2022. https://aws.amazon.com/message/41926/.
“There Are Unknown Unknowns.” In Wikipedia, December 9, 2022. https://en.wikipedia.org/w/index.php?title=There_are_unknown_unknowns&oldid=1126476638.
Amazon Web Services, Inc. “Using Load Shedding to Avoid Overload.” Accessed December 20, 2022. https://aws.amazon.com/builders-library/using-load-shedding-to-avoid-overload/.
[1] “Summary of the Amazon Kinesis Event in the Northern Virginia (US-EAST-1) Region.”
[2] “Summary of the Amazon S3 Service Disruption in the Northern Virginia (US-EAST-1) Region.”
I remember designing a large-scale distributed system as an AWS software engineer. Amazon’s philosophy that “you build it, you own it” means that engineers must, at all times, understandhow their underlying systems work. You’re expected to describe the behavior of your system and answer questions based on just a glance at your dashboards.
Is the system up or down? Are customers experiencing any issues? How many requests have been received at the P50, P90, or P99 levels?
With millions of customers using the system every second, it’s critical to quickly pinpoint problems, ideally without resorting to other means of troubleshooting (like diving through log files). Being able to detect issues rapidly requires effective use of AWS CloudWatch.
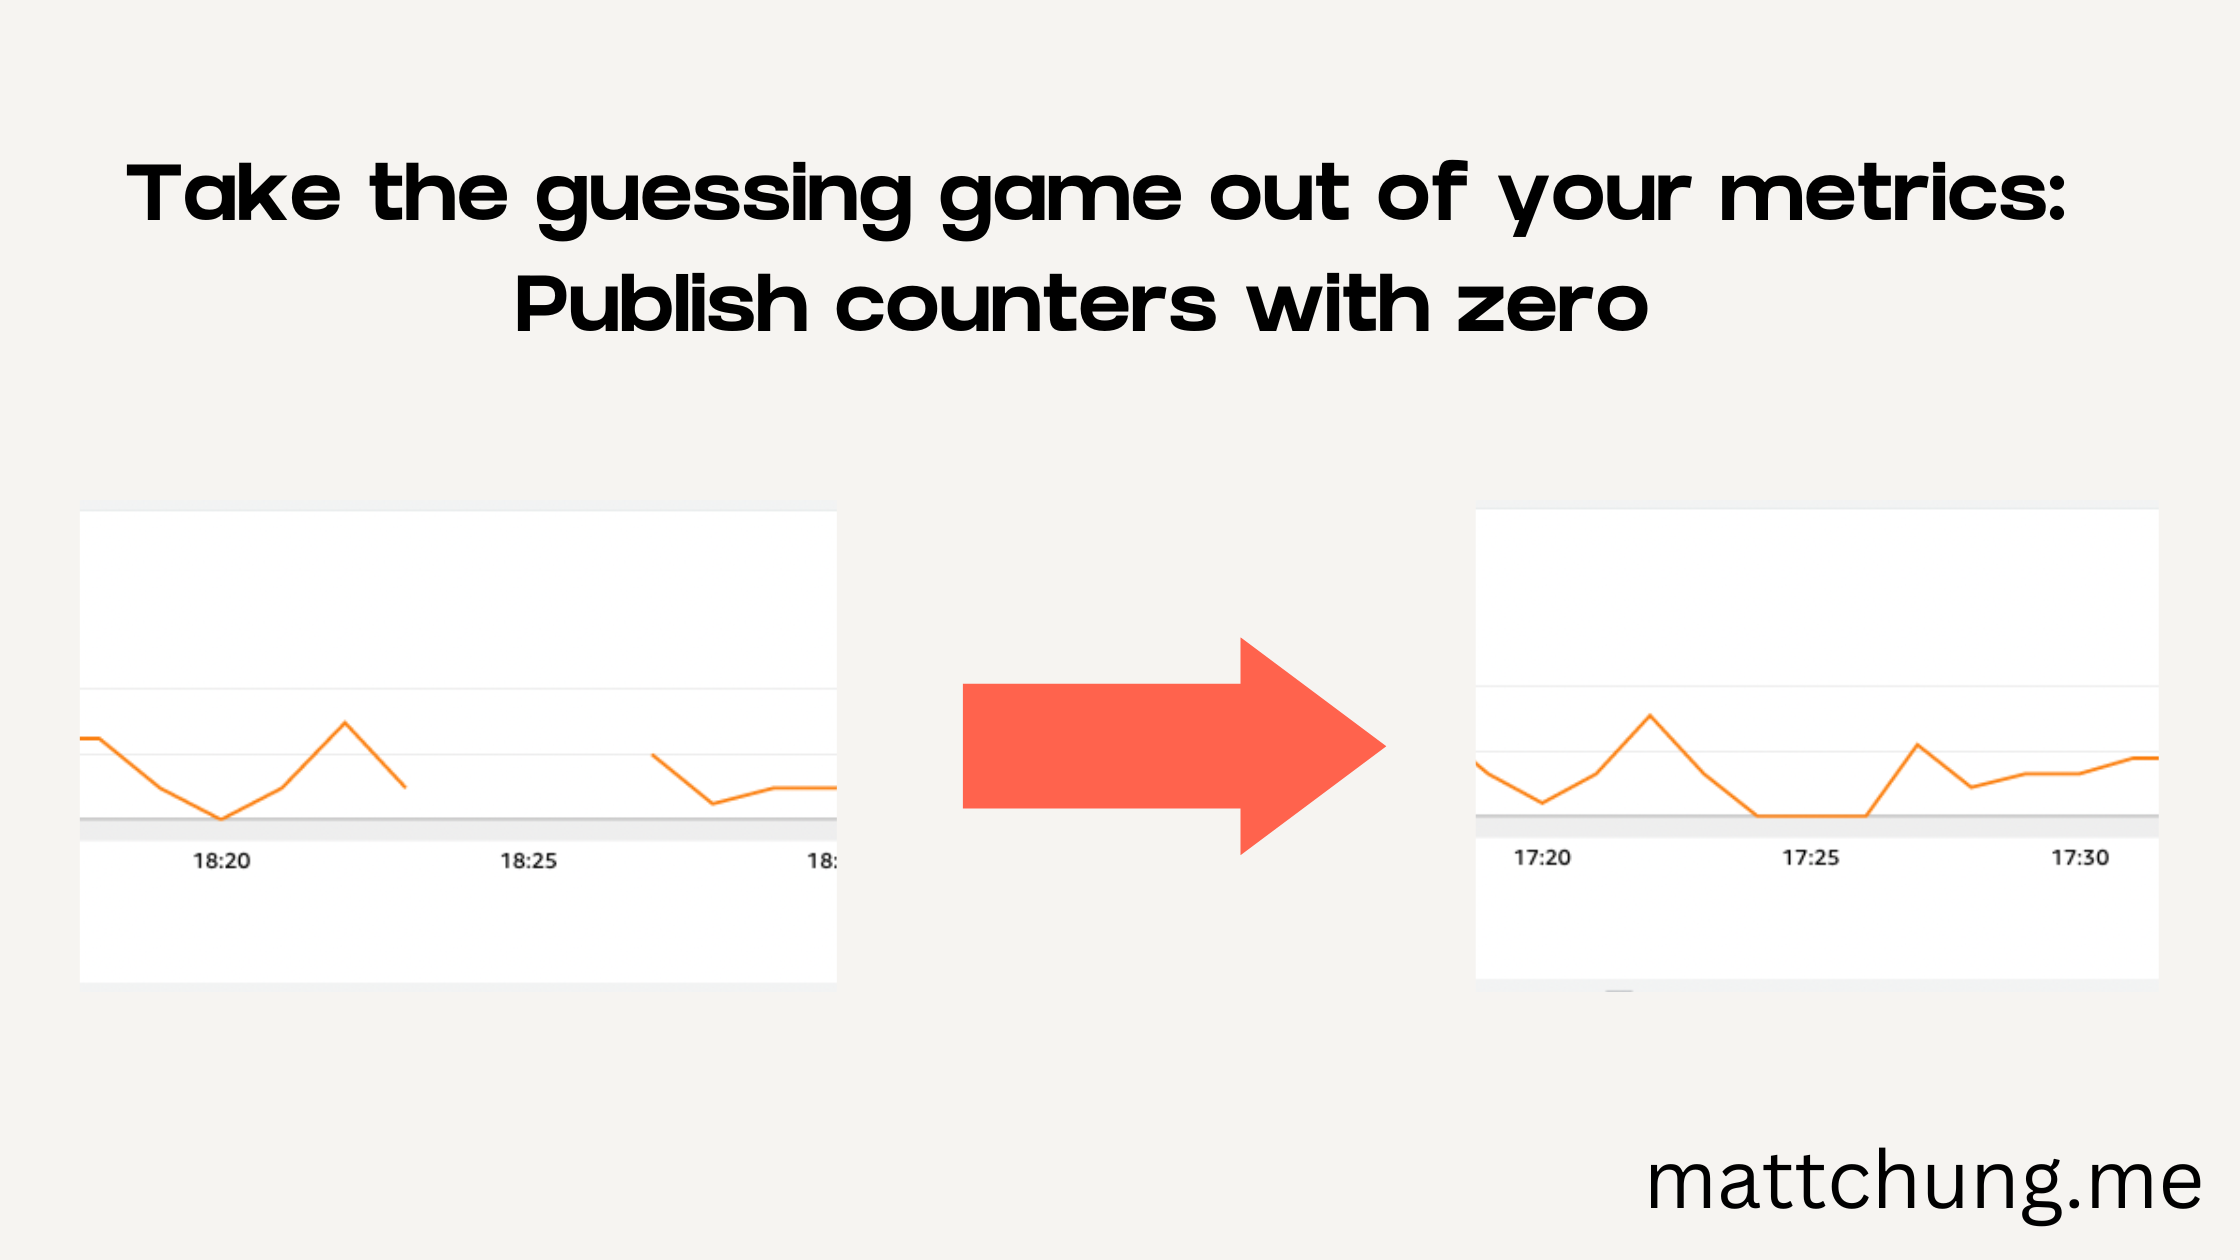
If you are new to instrumenting code and just beginning to publish custom metrics to CloudWatch, there are some subtle gotchas to beware of, one of which is only publishing metrics when the system is performing work. In other words, during periods of rest, the system can fail to provide metrics with zero value, which may make it difficult to distinguish between the following two scenarios:
The system is online/available, but there’s no user activity
The system is offline/unavailable
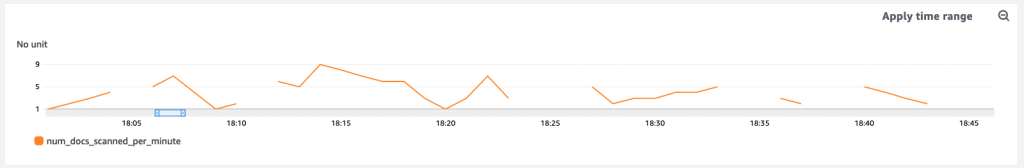
To differentiate the two, your software must constantly publish metrics even when the system sits idle. Otherwise, you end up with a graph that looks like this:
CloudWatch graph without publishing zero value metrics
What jumps out to you?
Yup, the gaps. They stand out because they represent missing data points. Do they mean we recently deployed an update with a bug that’s causing intermittent crashes? Is our system being affected by flaky hardware? Is the underlying network periodically dropping packets?
It could be anything.
Or, as in this case, nothing at all: just no activity.
No answer is not a real answer
[We] shouldn’t take absence of evidence as confirmation in either direction
Maya Shankar on Slight Change of Plans: Who is Scott Menke
Yesterday, my wife and I took our daughter to the local farmer’s market. While I was getting the stroller out of the car, my wife and daughter sat down to enjoy some donuts. An older gentleman came up and asked my wife whether she would be his partner for some square dancing; he was wearing a leather waistcoat and seemed friendly enough, so she said yes. During the dance, one of the instructors called out a complex set of directions and then asked if everyone understood and was ready to give it a go. All the newbie dancers just looked around nervously, to which he replied:
“Wonderful. I’ll take your silence as consent.”
For the record, silence never equates to consent. However, this does serve as a good analogy for the issue being discussed here about monitoring software systems. Getting no response from his students didn’t really tell the dance instructor that they were all set, and getting no metrics from our system doesn’t really tell us that our system is all set. No answer is not a real answer.
When it comes to monitoring and operating large software systems, we steer away from making any assumptions. We want data. “Lots,” as my three-year-old daughter would say.
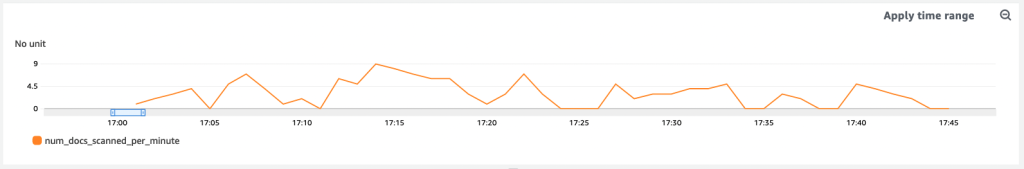
Back to our graph above: The gaps between data points represent idle times when the underlying system was not performing any meaningful work. Instead of not publishing a metric during those periods, we’ll now emit a counter with a value set to zero, which makes the new graph look like this:
CloudWatch graph with zero publishing zero value metrics
With the previous gaps now filled with data points, we now know that the system is up and running — it’s alive, just not handling any requests. The system wasn’t misbehaving, just idle. And now, if we see a graph that still has gaps, we know there’s a problem to investigate.
Lesson learned
We’ve now seen that any gaps in data can lead to unnecessary confusion. Even when the system is not performing any meaningful work , or not not processing any requests, we want to publish metrics, even if their values are zero. This way we can always know what’s really going on.
AWS CloudWatch is a corner service used by almost all AWS Service teams for monitoring and scaling software systems. Though it is a foundational software service that most businesses could benefit from, CloudWatch’s features are unintuitive and therefore often overlooked.
Out of the box, CloudWatch offers users the ability to plot both standard infrastructure and custom application metrics. However, new users can easily make the fatal mistake of plotting their graphs using the default statistic: average. Stop right there! Instead of averages, use percentiles. By switching the statistic type, you are bound to uncover operational issues that have been hiding right underneath your nose.
In this post, you’ll learn:
About the averages that can hide performance issues
Why software teams favor percentiles
How percentiles are calculated.
Example scenario: Slowness hiding in plain sight
Imagine the following scenario between a product manager, A, and an engineer, B, both of them working for SmallBusiness.
A sends B a slack message, alerting B that customers are reporting slowness with CoffeeAPI:
A: “Hey — some of our customers are complaining. They’re saying that CoffeeAPI is slower than usual”.
B: “One second, taking a look…”
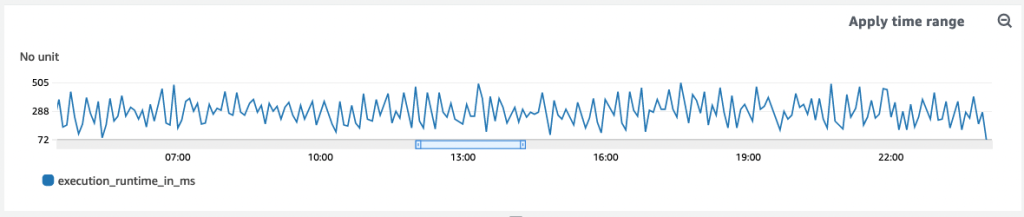
B signs into the AWS Console and pulls up the CloudWatch dashboard. Once the page loads, he scrolls down to the specific graph that plots CoffeeAPI latency, execution_runtime_in_ms
He quickly reviews the graph for the relevant time period, the last 24 hours.
There’s no performance issue, or so it seems. Latencies sit below the team defined threshold, all data points below the 600 milliseconds threshold:
Plotting the average execution runtime in millseconds
B: “Um…Look good to me” B reports back.
A: “Hmm…customers are definitely saying the system takes as long as 900ms…”
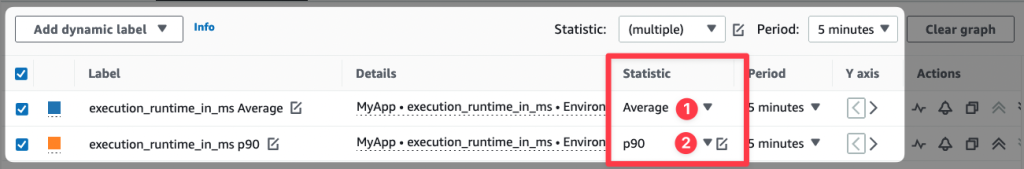
Switching up the statistic from avg to p90
In B’s mind, he has a gut feeling that something’s off — something isn’t adding up. Are customers misreporting issues?
Second guessing himself, B modifies the line graph, duplicating the `execution_runtine_in_ms` metric. He tweaks one setting -under the **statistic** field, he swaps out Average for P90.
Duplicating the metric and changing statistic to P90
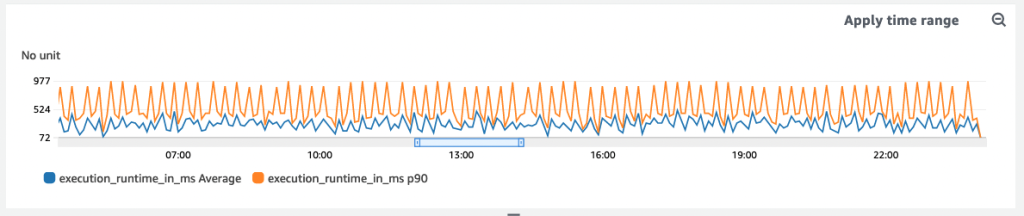
He refreshes the page and boom — there it is: datapoints revealing latency above 600 milliseconds!
Some customers’ requests are even taking as long as 998 milliseconds, 300+ milliseconds above the team’s defined service level operation (SLO).
P90 comparison
Problematic averages
Using CloudWatch metrics may seem simple at first. But it’s not that intuitive. What’s more is that by default, CloudWatch plots metrics with the average as the default statistic. As we saw above, this can hide outliers.
Plans based on assumptions about average conditions usually go wrong.
Sam Savage
For any given metric with multiple data points, the average may show no change in behavior throughout the day, when really, there are significant changes.
Here’s another example: let’s say we want to measure the number of requests per second.
Sounds simple,right? Not so fast.
First we need to talk measurements. Do we measure once a second, or by averaging requests over a minute? As we have already discovered, averaging requests can hide higher latencies that arrive in small bursts. Let’s consider a 60 second period as an example. If during the first 30 seconds there are 200 requests per second, and during the last 30 seconds there are zero requests per second, then the average would be 100 requests per second. However, in reality, the “instantaneous load” is twice that amount if there are 200 requests/s in odd-numbered seconds and 0 in others.
How to use Percentiles
Using percentiles makes for smoother software.
Swapping out average for percentile is advantageous for two reasons:
metrics are not skewed by outliers and just as important
every percentile data is an actual user experience, not a computed value like average
Continuing with the above example of a metric that tracks execution time, imagine an application publishing the following data points:
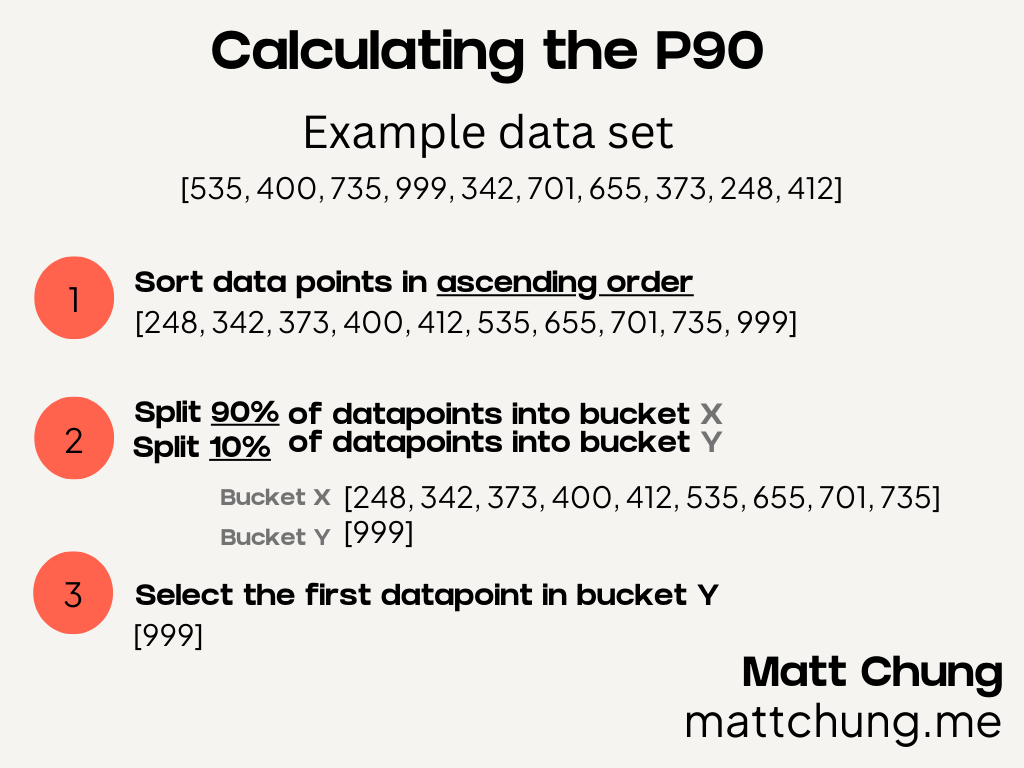
If you average the above data, it comes out to 540 milliseconds, yet for the P90, we get 999 milliseconds. Here’s how we arrived at that number:
How to calculate the P90
Let’s look at the above graphic in order to calculate the p90. First, start with sorting all the data points for a given time period, sorting them in ascending order from lowest to highest. Next, split the data points into two buckets. If you want the P90, you split the first 90% of data points into bucket one, and the remaining 10% into bucket two. Similarly, if you want the P50 (i.e. the median), assign 50% of the data points to the first bucket and 50% into the second.
Finally, after separating the data points into the two buckets, you select the first datapoint in the second bucket. The same steps can be applied to any percentile (e.g. P0, P50, P99).
Some common percentiles that you can use are p0, p50, p90, p99 and p99.9. You’ll want to use different percentiles for different alarm thresholds (more on this in an upcoming blog post). Say you are exploring CPU utilization, the p0, p50, and p100 give you the lowest usage, medium usage, and highest usage, respectively.
Summary
To conclude, let’s make sure that you’re using percentiles instead of averages so that when you use CloudWatch, you aren’t getting false positives.
Take your existing graphs and switch over your statistics from average to percentile today, and start uncovering hidden operational issues. Let me know if you make the change and how it positively impacts your systems.
In this blog post, you’ll learn how to deploy Python based worker using Digital Ocean’s Cloud App Platform for only $5.00 per month — all in less than 5 minutes.
Deploying a long running process
Imagine you’re building an designing a distributed system and as part of that software architecture, you have a Linux process that needs to run indefinitely. The process constantly checks a queue (e.g. RabbitMQ, Amazon SQS) and upon receiving a message, will either send an email notification or perform data aggregation. Regardless of the exact work that needs to being carried out, the process needs to be: always on, always running.
Alternative deployment options
A long running process can be deployed in a variety of ways, each with its own trade offs. Sure, you can launch an AWS EC2 instance and deploy your program like any other Linux process but that’ll requires additional scripting to stop/start,restart the process; in addition, you need to maintain and monitor the server, not to mention the unnecessary overprovisioning of the compute and memory resources.
Another option is to modify the program such that it’s short lived. The process starts, performs some body of work, then exits. This modification to the program allows you to deploy the program to AWS Lambda, which can be configured to invoke the job at certain intervals (e.g. one minute, five minutes); this adjustment to the program is necessary since Lambda is designed to run short-lived jobs, having a maximum runtime of 15 minutes.
Or, you can (as covered in this post), deploy a long running process in Digital Ocean using their App Cloud Platform.
Code sample
Below is a snippet of code. I removed most of the boiler plate and kept only the relevant section: the while loop that performs the body of work. For the full source code in this example, you can find it in example-github github repository
    while (proc_runtime_in_secs < MAX_PROC_RUNTIME_IN_SECONDS):


        logger.info("Proc running for %d seconds", proc_runtime_in_secs)
        start = time.monotonic()
        logger.info("Doing some work")
        work_for = random.randint(MIN_SLEEP_TIME_IN_SECONDS,
                                  MAX_SLEEP_TIME_IN_SECONDS)

        elapsed_worker_loop_time_start = time.monotonic()
        elapsed_worker_loop_time_end = time.monotonic()

        while ((elapsed_worker_loop_time_end - elapsed_worker_loop_time_start) < work_for):

            elapsed_worker_loop_time_end = time.monotonic()
            pass

        logger.info("Done working for %d", work_for)
        end = time.monotonic()
        proc_runtime_in_secs += end - start
If you are curious about why I’m periodically exiting the program after a certain amount of time, it’s a way to increase robustness. I’ll cover this concept in more detail in a separate post but for now, check out the bonus section at the bottom of this post.
Testing out this program locally
With the code checked out locally, you can launch the above program with the following command: python3 main.py.
Setting up Buildpack
Digital Ocean needs to detect your build and runtime enviroinment. Detection is made possible with build packs. For Python based applications, Digital Ocean scans the repository, searching for one of these three files:
requirements.txt
Pipfile
setup.py
In our example code repository, I’ve defined a requirements.txt (which is empty since there are no dependencies I declared) to ensure that Digital Ocean detects our repository as a Python based application.
Bonus Tip: Pinning the runtime
While not necessary, you should always pin your Python version runtime as a best practice. If you writing locally using Python-3.9.13, then the remote environment should also run the same version. Version matching saves yourself future head aches: a mismatch between your local Python runtime and Digital Ocean’s Python runtime can cause unnecessary and avoidable debugging sessions.
Runtime.txt
python-3.9.13
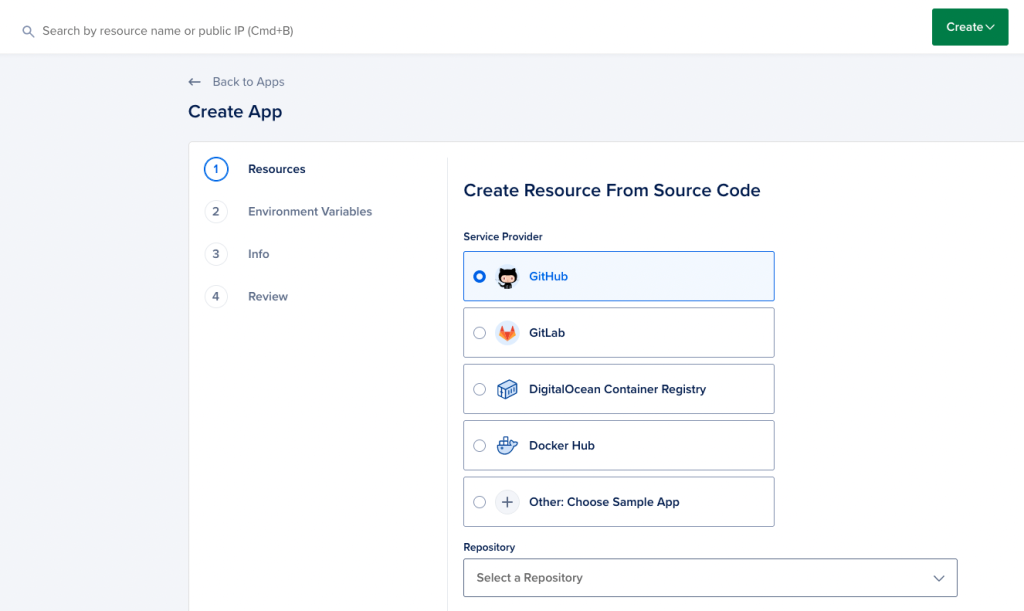
Step by Step – Deploying your worker
Follow the below steps on deploying your Python Github Repository as a Digital Ocean worker.
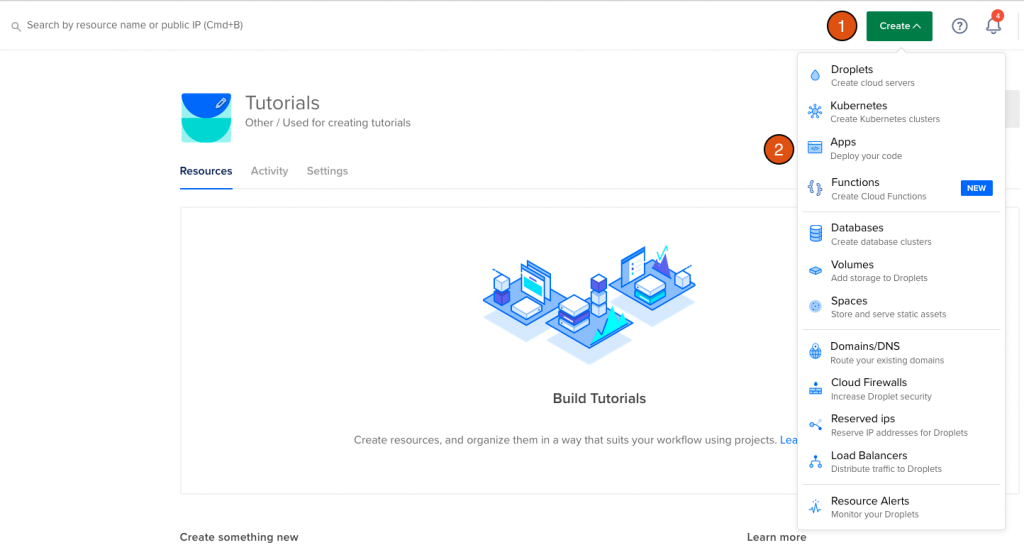
1. Creating a Digital Ocean “App”
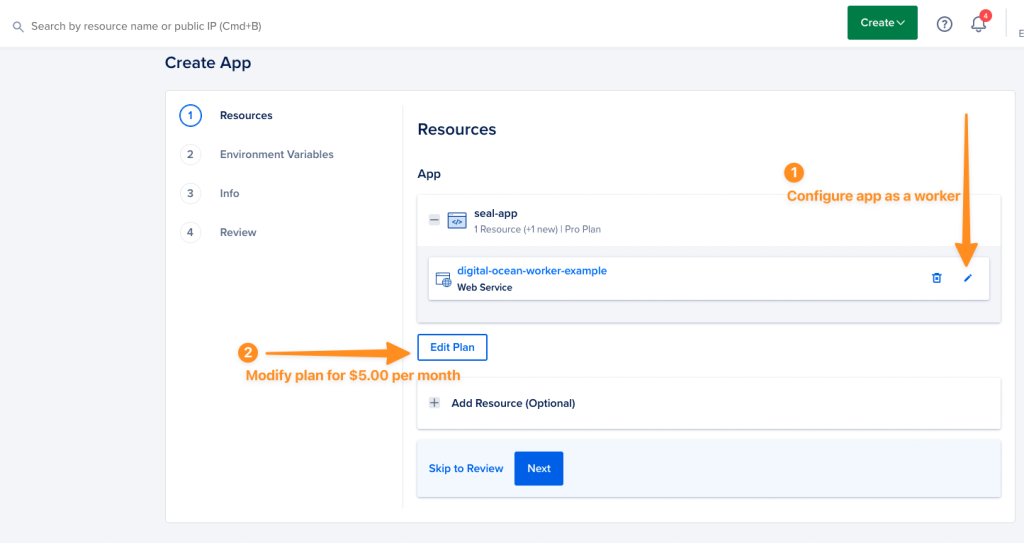
Log into your digital ocean account and in the top right corner, click “Create” and then select “Apps”.
Then, you need to configure the application as a worker and edit the plan from the default price of $15.00 per month.
2a – Configure app as a worker
By default, Digital Ocean assumes that you are building a web service. In this case, we are deploying a worker so select “worker” from the drop down menu.
2b – Edit the plan
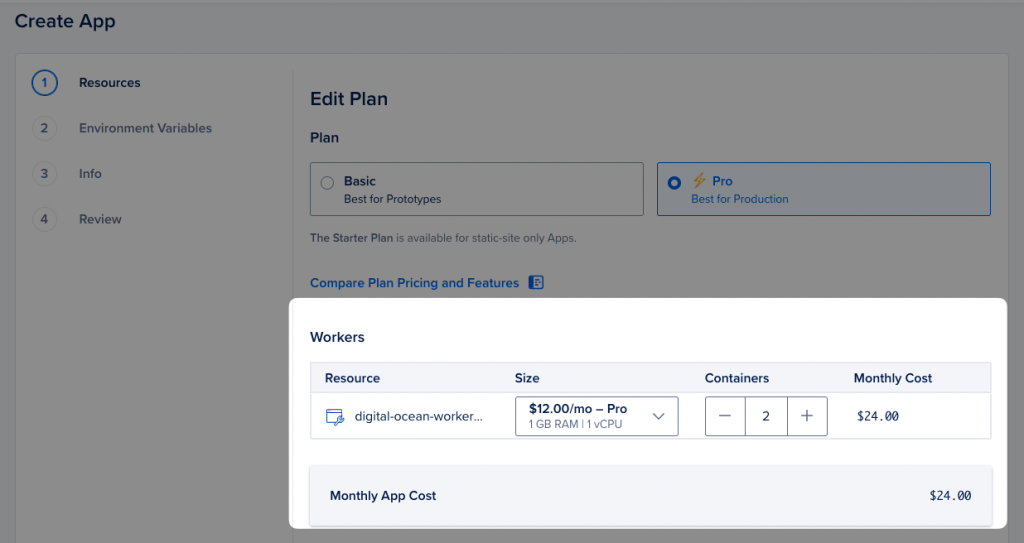
By default, Digital Ocean chooses a worker with 1GB ram and 1vCPU, costing $24.00 per month. In this example, we do NOT need that entire memory footprint and can get away with half the memory requirements. So let’sw choose 512MB ram, dropping the cost down to $5.00
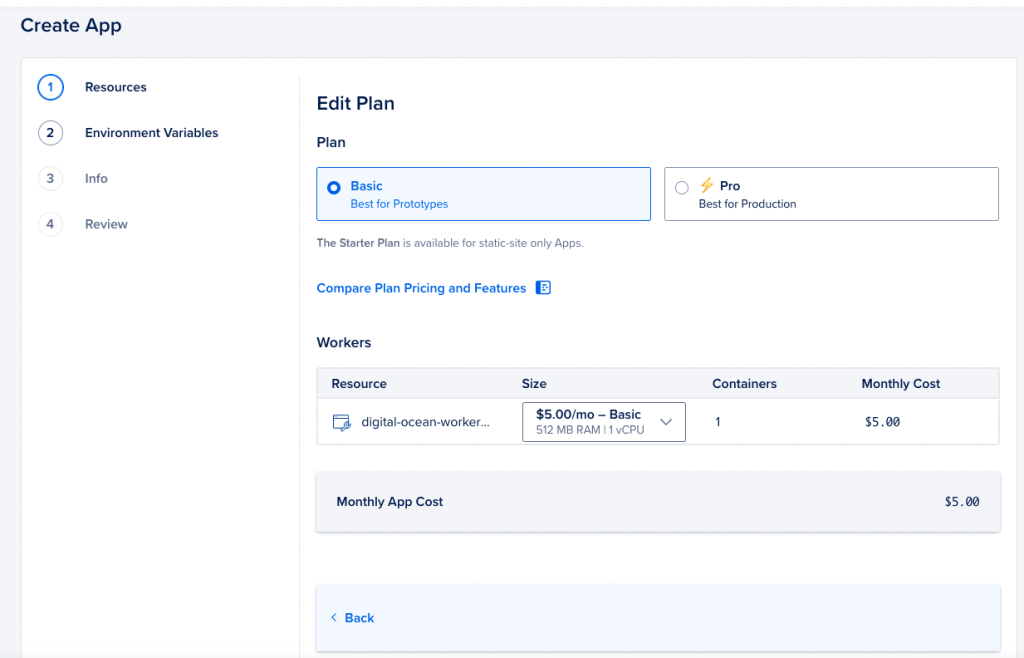
Select the “Basic Plan” radio button and adjust the resource size from 1GB RAM to 512 MB ram.
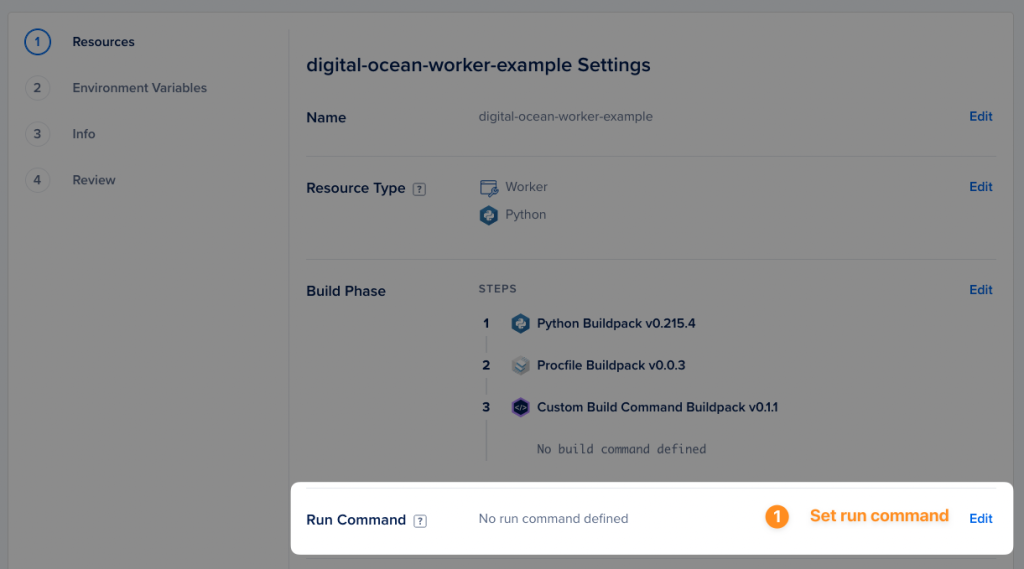
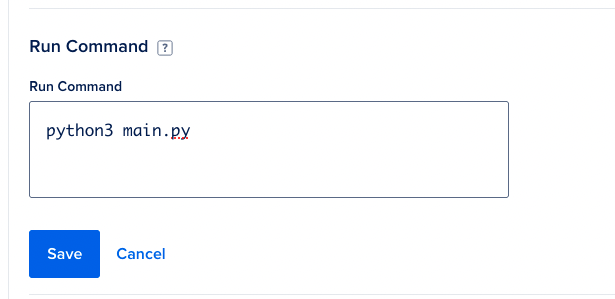
Configure the run command
Although we provided other files (i.e. requirements.txt) so that Digital Ocean detects the application as a Python program, we still need to specify wihch command will actually run.
You’re done!
That’s it! Select your datacenters (e.g. New York, San Francisco) and then hit that save button.
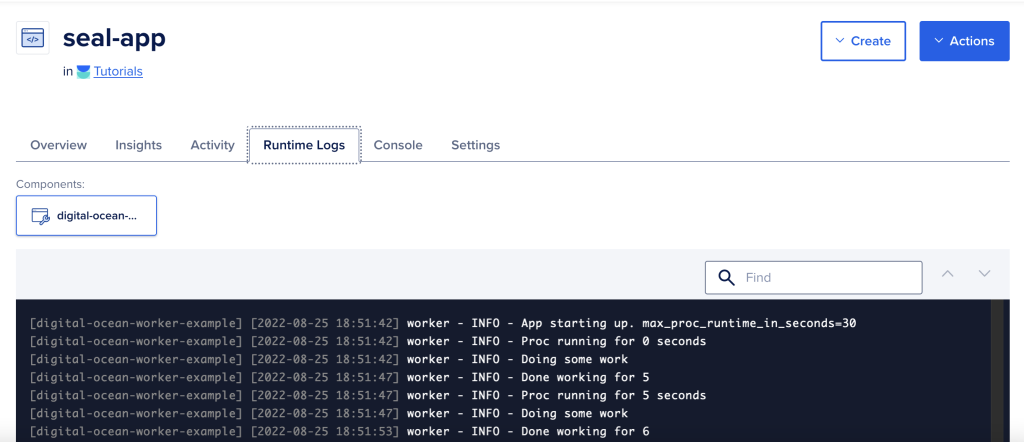
The application will now be deployed and within a few minutes, you’ll be able to monitor the application by reviewing the Runtime logs.
Monitoring the runtime logs
In our sample application, we are writing to standard output/standard error. By doing writing to these file handles, Digital Ocean will capture these messages and log them for you, including a timestamp. Useful for debugging and troubleshooting errors or if your application crashes.
Bonus: Automatic restart of your process
If you worker crashes, Digital Ocean monitors the process and will automatically start it. That means, no need to have a control process that forks your process and monitors the PID.
Who is my audience here? Self-taught developers who want to deploy their application cost effectively, CTOs who are trying to minimize cost for running a long running process
Summary
So in this post, we took your long running worker (Python) process and deployed it on Digital Ocean for $5.00 per month!
As part of your digital organization journey, you’re likely using a combination of two strategies to organize your digital database:
Using folders/directories for imposing structure and creating well-defined categories
Leveraging keywords to overcome the constraints of either-or categories.
While choosing keywords may seem simple at first, it’s a skill that develops overtime and improves with deliberate practice. Ineffective keyword selection creates challenging situations, where you are either unable to retrieve documents based off of the original keywords you chose, or where you spend an inordinate amount of time searching for the document.
We’ve all been there, and it’s not fun.
Below is a quote that Laura Look from BitSmith Software wants to save for future use. In sharing it, she exemplifies how finicky choosing the right keywords can be challenging:
The hand that rocks the cradle rules the world.
William Ross Wallace
If the above quote were tucked away in your digital database without any keywords assigned (or the wrong keywords), then you would be in a bind. Searching for the tags mother or children or parenting would fail to return this quote in the search results.
So what can you do to be more effective when choosing keywords?
Best practices
When tagging a file with a keyword, don’t jump the gun and choose the first keywords that pop into your head. Pause. Wait a moment … reflect … and then:
Think about your future self
Scan your existing keywords
Keep your list of indexes sparse
1. Think about your future self
Think about the context in which you will need this article again
Ask yourself this: why are you even investing time and energy into your personal information management? What’s the point? Are you someone who enjoys collecting — an archiver? Or are you looking to do something with the material — a writer? For most of us, the value of digital organization is that it enables us to unleash our creativity. As Daniel Wessel puts it, the whole point of organizing your creativity is to “Keep the focus on the product, what you create, not the organization for the product.”
So, as a creative, how do you avoid turning into an archivist? Or if you are already an archivist, how do you break out of that role? Sonke Ahdrins suggests that you change your mode of thinking. Instead of wondering where you are going to store the document, think about how you will retrieve it.
Before saving a document and tagging it with any keywords, ask yourself:
In which circumstance will I want to stumble upon this [document], even if I forget it
Sonke Ahrins
Reflect on the topics (e.g. glucose levels as it relates to diabetes, cold exposure and hormone excretion) for which you might want to use later. When assigning keywords, alwaysalwaysalways have an eye towards the topics you are working on or interested in — never never never save a document in isolation.
2. Review your existing index of keywords
As mentioned in the previous section, saving and tagging a document is not an isolated activity. You must always consider the context: context is key. To that end, acquaint yourself with your existing keywords; most software applications provide some sort of view that lists all your keywords as well as the number of items tagged with each keyword. This review serves as a reminder for the topics that spark your interest. Routinely reviewing your keyword index is a habit that pays dividends in the future back when you want to search for something specific.
If you don’t periodically review all your keywords, then you may end up creating duplicate keywords that have the same semantic meaning and polluting your keyword database, undermining one of the fundamental benefits of keywords: enabling you to quickly jump to a topic of interest.
3. Keep your list of keywords sparse
“keep your index easy to manage by concentrating on the context when an article will actually be needed”
You need to be stingy with the keywords you select. Be stingy. Choose them sparsely. It’s one of those things where less is better. Think of it like a digital diet. By keepign your index easy to manage, you concentrate on the context when an article is needed.
Summary
Not rushing when choosing keywords improves your digital organization fitness. Before saving and tagging documents, scan your existing bodies of work, and see where this document might fit in the larger scheme. Review your existing keywords. Work with your system. And most importantly:
Practice, practice, practice.
References
Ahrens, Sönke. How to Take Smart Notes: One Simple Technique to Boost Writing, Learning and Thinking, 2022.
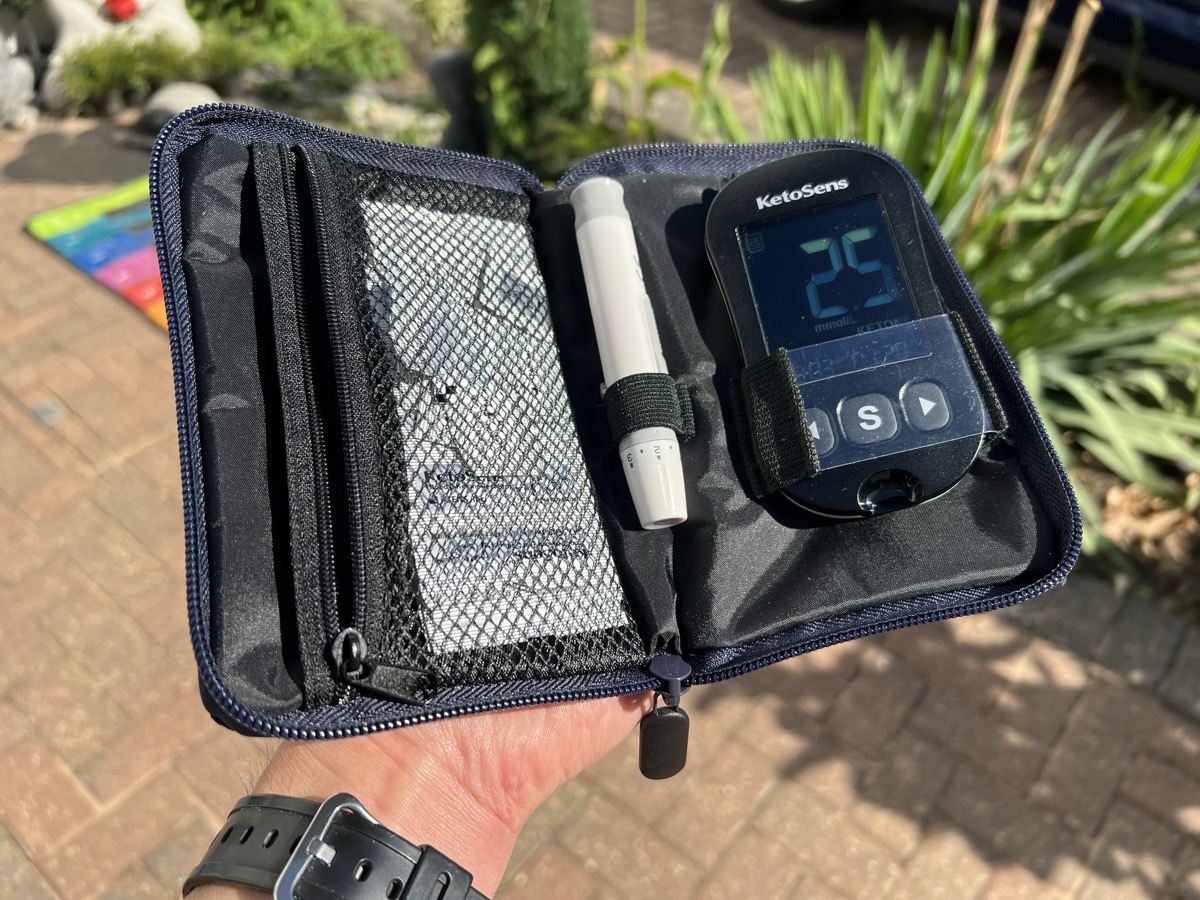
I began my intermittent fasting (i.e. time restricted eating) journey just over 3 weeks ago and since the beginning, I’ve been measuring, tracking, monitoring both my glucose and ketone body levels. Collecting these data points require pricking my fingers with a lancet and feeding small blood samples into the monitoring devices.
Although the process of drawing blood is somewhat painful, annoying and sometimes inconvenient, these minor drawbacks are worth the trade off: developing a deeper understanding of my body. An additional downside of this routine blood sampling is that it can be somewhat cost prohibitive: each ketone test strip costs about $1.00 and because I collect about 8-12 blood samples per day, the total cost per week ranges anywhere between $50-75 dollars.
Nutritional Ketosis
With the test strips, I now know when my body enters nutritional ketosis, a metabolic state when one’s body produces an elevated amount of ketone bodies (i.e. acetoacetate, acetone, beta-hydroxybutyrate). Nutritional ketosis is an indicator of lypolysis — a process in which bodies burn fat for fuel, a desirable state when trying to lose weight.
So … how do you know your body is in nutritional ketosis?
Nutritional ketosis can be defined as 0.5 to 3.0 millimoles per liter (mmol/L) of beta-hydroxybutyrate being present in blood. So if the meter reports a value within that range, then you are burning fat!
A not-so-strict ketogenic diet
My body is still able to transition into nutritional ketosis despite not adhering to a strict ketogenic diet, which is defined a very low carbohydrate or low carbohydrate diet, consuming between 30-50g or consuming less than 150g per day, respectively. Instead of adding more constraints into my life, I’m (more or less) just restricting my eating window, following what is known as a 16:8 intermittent fast — 16 hours window of fasting, 8 hour of eating (also known as post-postprandial state).
Not following a strict ketogenic diet does lower the probability of entering nutritional ketosis. I had initially thought that right off the bat, my body would fairly quickly (maybe within three or four days) enter nutritional ketosis at the tail of my fasting window. But according to the data I’ve collected, I’ve discovered that normally, throughout the day, my ketone body levels hover anywhere between 0.1 and 0.4 mmol/L — below the nutritional ketosis range.
Four discrete instances of nutritional ketosis
0.5 mmol/L – Playing pickle ball early in the morning while in the fasted state
0.8 mmol/L – Playing tennis during while in the fasted state